PROTECTED SOURCE SCRIPT
מעודכן ENRER RB
rubber band
הערות שחרור
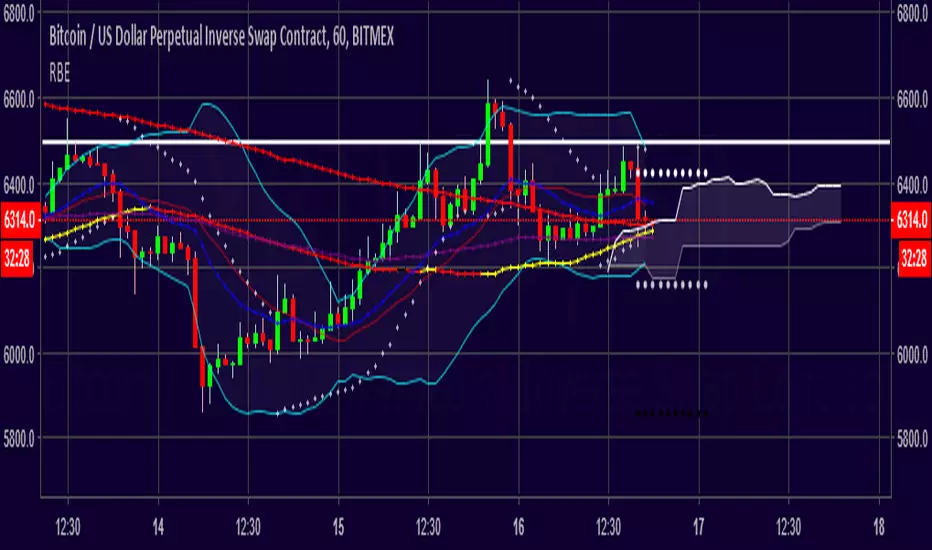
Bollinger Bands : A well known system for defining volatility and Squeeze / expansion
Moving Averages :
SMA 50 (color coded based on direction) for showing the dynamic trend line
EMA 15 for showing local resistance / support lines
SMA 100 and 200 for showing higher time frame resistance/ support or dynamic trend lines
Ichimoko Cloud:
From all the Ichimoko indicator system, it's cloud is one of the best parts to show you the future possible resistance/support zones but it will occlude the chart, so, why not have the needed part?
Parabolic Sar :
One the good indicators to show the shift in the momentum and the power behind it, color coded for easier definition of bullish from bearish
::::: IN NEW V. you can active to show ichimoku lines too ::::::
הערות שחרור
Pivot Points And Fibonacci Active from inputs
סקריפט מוגן
סקריפט זה פורסם כמקור סגור. עם זאת, תוכל להשתמש בו בחופשיות וללא כל מגבלות – למד עוד כאן
כתב ויתור
המידע והפרסומים אינם מיועדים להיות, ואינם מהווים, ייעוץ או המלצה פיננסית, השקעתית, מסחרית או מכל סוג אחר המסופקת או מאושרת על ידי TradingView. קרא עוד ב־תנאי השימוש.
סקריפט מוגן
סקריפט זה פורסם כמקור סגור. עם זאת, תוכל להשתמש בו בחופשיות וללא כל מגבלות – למד עוד כאן
כתב ויתור
המידע והפרסומים אינם מיועדים להיות, ואינם מהווים, ייעוץ או המלצה פיננסית, השקעתית, מסחרית או מכל סוג אחר המסופקת או מאושרת על ידי TradingView. קרא עוד ב־תנאי השימוש.