PROTECTED SOURCE SCRIPT
Sector Daily Gain/Loss Table
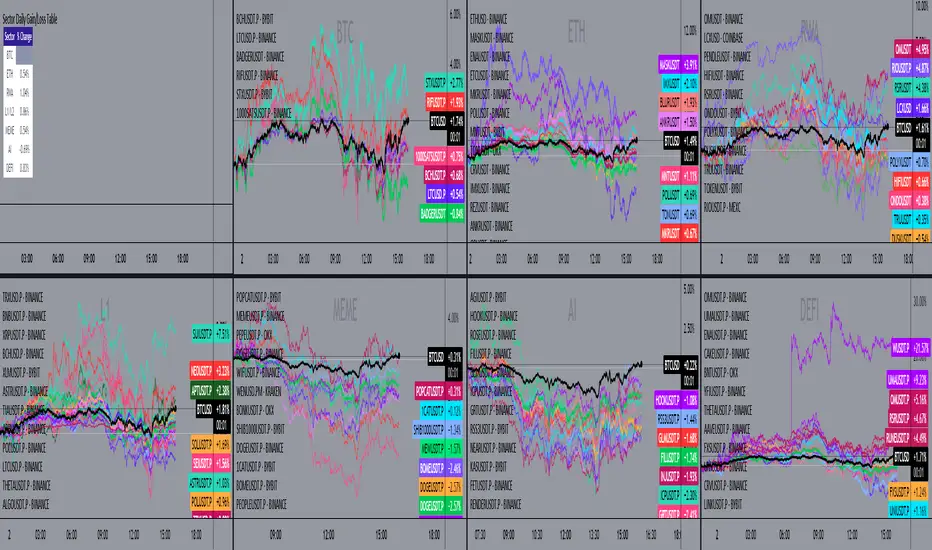
Overview: The "Sector Daily Gain/Loss Table" is a custom TradingView indicator designed to display the daily percentage changes in selected cryptocurrency sectors. This indicator provides a comprehensive view of the performance of various cryptocurrencies organized into specific sectors, helping traders and analysts to make informed decisions based on sector performance.
Key Features:
Dynamic Data Retrieval: The indicator retrieves daily closing prices for multiple cryptocurrencies across different exchanges (Binance and Bybit) using the request.security function. This allows users to monitor real-time price movements.
Sectors Covered:
BTC Sector: Includes Bitcoin (BTC).
ETH Sector: Includes Ethereum (ETH).
RWA Sector: Comprises various assets such as OM, ONDO, POLYX, SNX, PENDLE, and HIFI.
L1/L2 Sector: Features major Layer 1 and Layer 2 solutions including ETH, BNB, SOL, XRP, TON, ADA, AVAX, DOT, SUI, APT, ICP, POL, and more.
MEME Sector: Showcases popular meme coins like DOGE, SHIB, PEPE, WIF, BONK, FLOKI, ORDI, BOME, and NEIRO, along with MEW and POPCAT from Bybit.
AI Sector: Highlights AI-related tokens such as TAO, FET, GRT, THETA, WLD, and TURBO.
DEFI Sector: Displays decentralized finance projects including UNI, AAVE, INJ, RUNE, MKR, JUP, LDO, PENDLE, CAKE, LUNA, RAY, OSMO, KAVA, and RSR.
Average Gain/Loss Calculations: For each sector, the indicator calculates the average percentage change in price based on the included cryptocurrencies, offering insights into sector-wide performance trends.
Table Display: The performance metrics are presented in a clean and organized table format on the TradingView chart, providing easy access to vital information for traders.
User-Friendly Design: The table is designed to be visually appealing and informative, with color coding and clear labeling for each sector and its corresponding percentage change.
Usage: Traders can utilize this indicator to quickly assess the performance of various cryptocurrency sectors and make informed trading decisions based on the daily changes in sector performance.
סקריפט מוגן
סקריפט זה פורסם כמקור סגור. עם זאת, תוכל להשתמש בו בחופשיות וללא כל מגבלות – למד עוד כאן
כתב ויתור
המידע והפרסומים אינם מיועדים להיות, ואינם מהווים, ייעוץ או המלצה פיננסית, השקעתית, מסחרית או מכל סוג אחר המסופקת או מאושרת על ידי TradingView. קרא עוד ב־תנאי השימוש.
סקריפט מוגן
סקריפט זה פורסם כמקור סגור. עם זאת, תוכל להשתמש בו בחופשיות וללא כל מגבלות – למד עוד כאן
כתב ויתור
המידע והפרסומים אינם מיועדים להיות, ואינם מהווים, ייעוץ או המלצה פיננסית, השקעתית, מסחרית או מכל סוג אחר המסופקת או מאושרת על ידי TradingView. קרא עוד ב־תנאי השימוש.