OPEN-SOURCE SCRIPT
מעודכן KINSKI Flexible Vortex Indicator
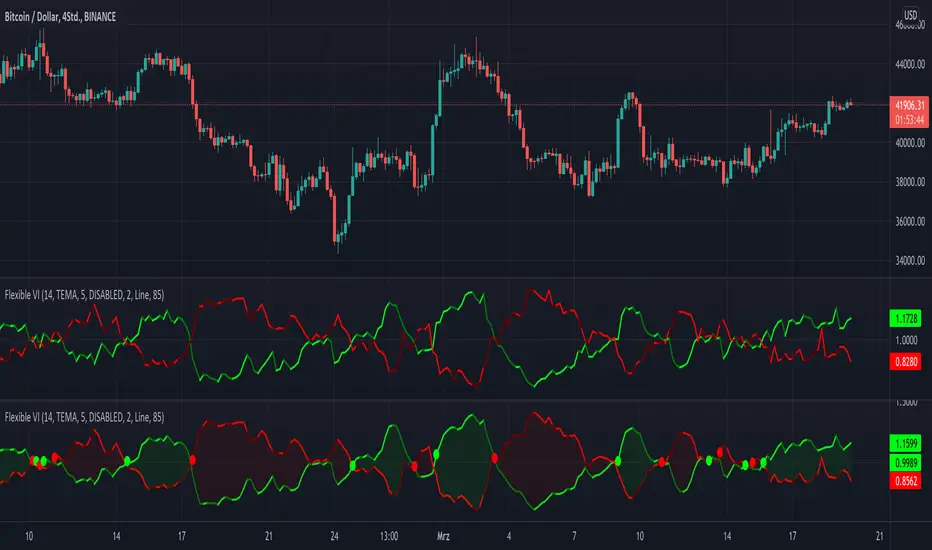
The Vortex indicator is based on two trend lines that indicate an uptrend (VI+) or a downtrend (VI-) in the current market. This can be used to determine trend reversals or confirmations of current trends and directions. The number of periods is usually between 10 and 25. This indicator has 14 periods as its default value. You can adjust this value in the settings according to your needs.
A buy signal can be interpreted when VI+ is greater than VI-. Conversely, a sell signal exists when VI+ is smaller than VI-. Whenever a "crossing point" occurs, an imminent trend change can also be anticipated. If the differences from the highs and lows become larger and larger, a breakout is to be expected.
When using this indicator, please note that VI+ and VI*crossings, especially during choppy price movements, can trigger false trading signals.
What distinguishes this Vortex indicator from others of this type?
The following settings are possible:
A buy signal can be interpreted when VI+ is greater than VI-. Conversely, a sell signal exists when VI+ is smaller than VI-. Whenever a "crossing point" occurs, an imminent trend change can also be anticipated. If the differences from the highs and lows become larger and larger, a breakout is to be expected.
When using this indicator, please note that VI+ and VI*crossings, especially during choppy price movements, can trigger false trading signals.
What distinguishes this Vortex indicator from others of this type?
- Possibility to choose between different template templates that influence the display
- Extensive setting options to emphasize upward and downward movements and cross points
The following settings are possible:
- "Length": Adjustable period / default value = 14
- "Template": "DISABLED", "Clear", "Informative" / Default value = DISABLED
- "Line: Size": Thickness of the vortex lines / default value = 2
- "Line: Style Type": Display variants (options: "Line", "Stepline") / default value = "Line".
- "Line: Up/Down Movements": Up and down movements are highlighted in color / default value = AN
- "Cross Points: On/Off": Cross points are displayed / default value = OFF
- "Bands: On/Off": Vortex lines are connected as a band / default value = OFF
- "Bands: Transparency": Strength of transparency / default value = 85
- Color codes: The color codes are explained in the settings
הערות שחרור
- Convert to PineScript5
הערות שחרור
- Add optional Feature 'Remove Noise: On/Off' (disabled by default) ==> Smoothing the vortex trend line for a better view
הערות שחרור
- add new MA Type => "TEMA" (Triple EMA)
- Refactor some Parts of Code
סקריפט קוד פתוח
ברוח האמיתית של TradingView, יוצר הסקריפט הזה הפך אותו לקוד פתוח, כך שסוחרים יוכלו לעיין בו ולאמת את פעולתו. כל הכבוד למחבר! אמנם ניתן להשתמש בו בחינם, אך זכור כי פרסום חוזר של הקוד כפוף ל־כללי הבית שלנו.
My published Scripts:
de.tradingview.com/u/KINSKI/
Appreciation of my work: paypal.com/paypalme/steffenhollstein
de.tradingview.com/u/KINSKI/
Appreciation of my work: paypal.com/paypalme/steffenhollstein
כתב ויתור
המידע והפרסומים אינם מיועדים להיות, ואינם מהווים, ייעוץ או המלצה פיננסית, השקעתית, מסחרית או מכל סוג אחר המסופקת או מאושרת על ידי TradingView. קרא עוד ב־תנאי השימוש.