OPEN-SOURCE SCRIPT
מעודכן FTFC (The Strat)
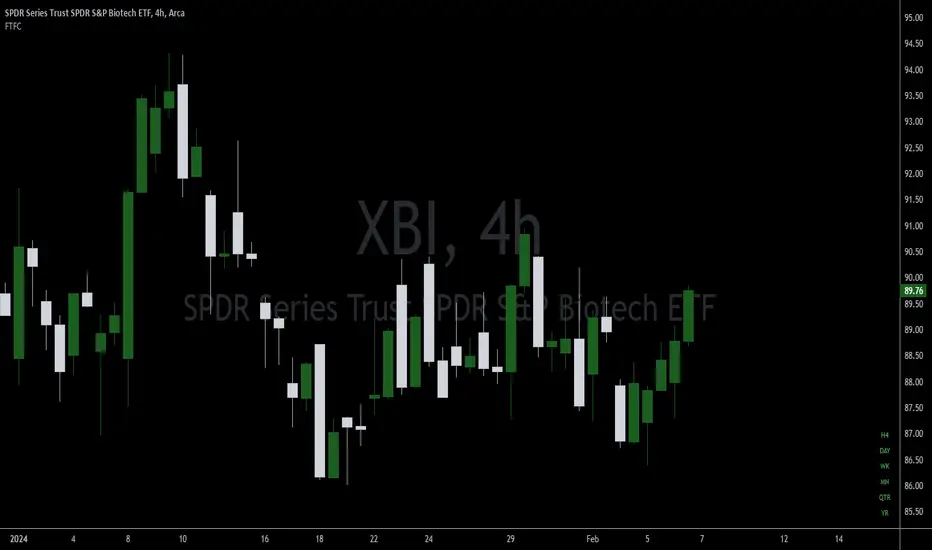
This indicator provides the status (red="down/short", green="up/long") of the current and higher timeframes in conjunction with The Strat, created by Rob Smith. In The Strat, Rob states that one should trade in the direction of timeframe continuity. What this means is if the majority of higher time frames are trading to the upside, one should only take long positions on the current timeframe. The more timeframes trading in the same direction increases the likelihood that a trade will work out in the trader's favor. The purpose of this indicator is to provide a visual cue as to when the current symbol has reached Full Timeframe Continuity (FTFC). For example, M5, M15, M30, H1 all green, only take long trades on the M5 time frame.
הערות שחרור
Added Quarterly and Yearly identifiers.הערות שחרור
Fixed an issue where Month and Week were not displaying correctly unless the chart was on that specific timeframe.סקריפט קוד פתוח
ברוח האמיתית של TradingView, יוצר הסקריפט הזה הפך אותו לקוד פתוח, כך שסוחרים יוכלו לעיין בו ולאמת את פעולתו. כל הכבוד למחבר! אמנם ניתן להשתמש בו בחינם, אך זכור כי פרסום חוזר של הקוד כפוף ל־כללי הבית שלנו.
כתב ויתור
המידע והפרסומים אינם מיועדים להיות, ואינם מהווים, ייעוץ או המלצה פיננסית, השקעתית, מסחרית או מכל סוג אחר המסופקת או מאושרת על ידי TradingView. קרא עוד ב־תנאי השימוש.
סקריפט קוד פתוח
ברוח האמיתית של TradingView, יוצר הסקריפט הזה הפך אותו לקוד פתוח, כך שסוחרים יוכלו לעיין בו ולאמת את פעולתו. כל הכבוד למחבר! אמנם ניתן להשתמש בו בחינם, אך זכור כי פרסום חוזר של הקוד כפוף ל־כללי הבית שלנו.
כתב ויתור
המידע והפרסומים אינם מיועדים להיות, ואינם מהווים, ייעוץ או המלצה פיננסית, השקעתית, מסחרית או מכל סוג אחר המסופקת או מאושרת על ידי TradingView. קרא עוד ב־תנאי השימוש.