OPEN-SOURCE SCRIPT
Liquidity Heatmap & Volume-Weighted RSI
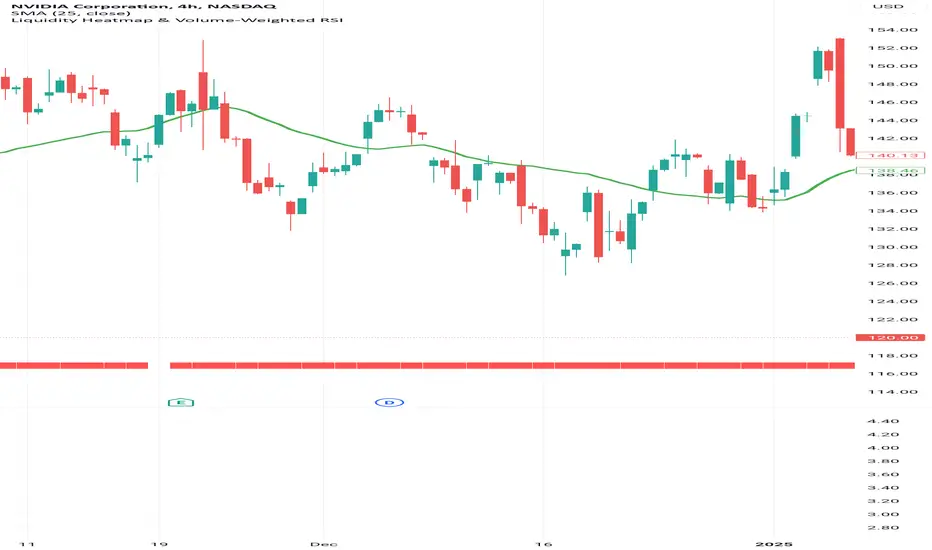
Liquidity Heatmap Indicator with Volume-Weighted RSI
Description:
The Liquidity Heatmap Indicator with Volume-Weighted RSI (VW-RSI) is a powerful tool designed for traders to visualize market liquidity zones while integrating a volume-adjusted momentum oscillator. This indicator provides a dynamic heatmap of liquidity levels across various price points and enhances traditional RSI by incorporating volume weight, making it more responsive to market activity.
Key Features:
Liquidity Heatmap Visualization: Identifies high-liquidity price zones, allowing traders to spot potential areas of support, resistance, and accumulation.
Volume-Weighted RSI (VW-RSI): Enhances the RSI by factoring in trading volume, reducing false signals and improving trend confirmation.
Customizable Sensitivity: Users can adjust parameters to fine-tune heatmap intensity and RSI smoothing.
Dynamic Market Insights: Helps identify potential price reversals and trend strength by combining liquidity depth with momentum analysis.
How to Use:
1. Identify Liquidity Zones: The heatmap colors indicate areas of high and low liquidity, helping traders pinpoint key price action areas.
2. Use VW-RSI for Confirmation: When VW-RSI diverges from price near a liquidity cluster, it signals a potential reversal or continuation.
3. Adjust Parameters: Fine-tune the RSI period, volume weighting, and heatmap sensitivity to align with different trading strategies.
This indicator is ideal for traders who rely on order flow analysis, volume-based momentum strategies, and liquidity-driven trading techniques.
סקריפט קוד פתוח
ברוח האמיתית של TradingView, יוצר הסקריפט הזה הפך אותו לקוד פתוח, כך שסוחרים יוכלו לעיין בו ולאמת את פעולתו. כל הכבוד למחבר! אמנם ניתן להשתמש בו בחינם, אך זכור כי פרסום חוזר של הקוד כפוף ל־כללי הבית שלנו.
כתב ויתור
המידע והפרסומים אינם מיועדים להיות, ואינם מהווים, ייעוץ או המלצה פיננסית, השקעתית, מסחרית או מכל סוג אחר המסופקת או מאושרת על ידי TradingView. קרא עוד ב־תנאי השימוש.