OPEN-SOURCE SCRIPT
2024 - Seasonality - Open to Close
Script Description:
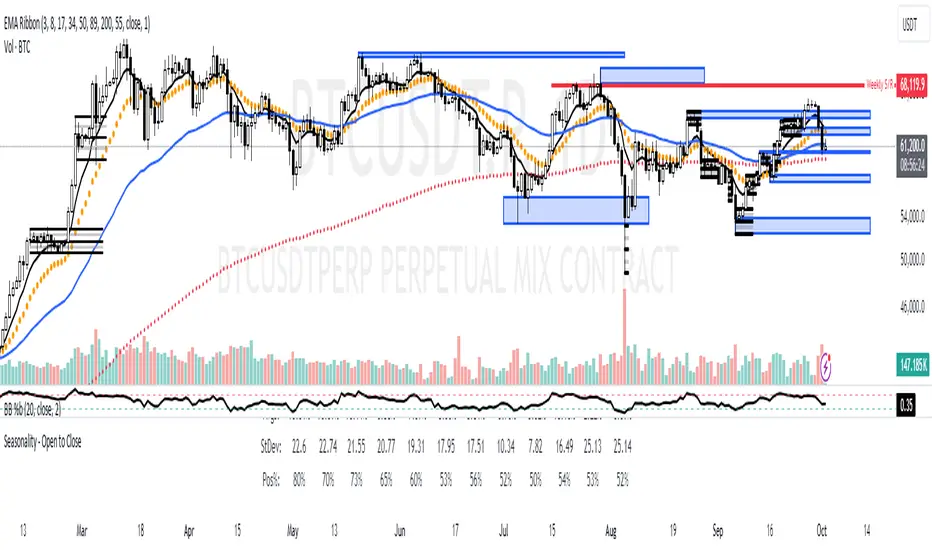
This Pine Script is designed to visualise **seasonality** in the financial markets by calculating the **open-to-close percentage change** for each month of a selected asset. It creates a **heatmap** table to display the monthly performance over multiple years. The script provides detailed statistical summaries, including:
- **Average monthly percentage changes**
- **Standard deviation** of the changes
- **Percentage of months with positive returns**
The script also allows users to adjust colour intensities for positive and negative values, specify which year to start from, and skip specific months. Key metrics such as averages, standard deviations, and percentages of positive months can be toggled on or off based on user preferences. The result is a clear, visual representation of how an asset typically performs month by month, aiding in seasonality analysis.
סקריפט קוד פתוח
ברוח האמיתית של TradingView, יוצר הסקריפט הזה הפך אותו לקוד פתוח, כך שסוחרים יוכלו לעיין בו ולאמת את פעולתו. כל הכבוד למחבר! אמנם ניתן להשתמש בו בחינם, אך זכור כי פרסום חוזר של הקוד כפוף ל־כללי הבית שלנו.
כתב ויתור
המידע והפרסומים אינם מיועדים להיות, ואינם מהווים, ייעוץ או המלצה פיננסית, השקעתית, מסחרית או מכל סוג אחר המסופקת או מאושרת על ידי TradingView. קרא עוד ב־תנאי השימוש.