OPEN-SOURCE SCRIPT
Maancyclus Volatiliteitsindicator (2025)
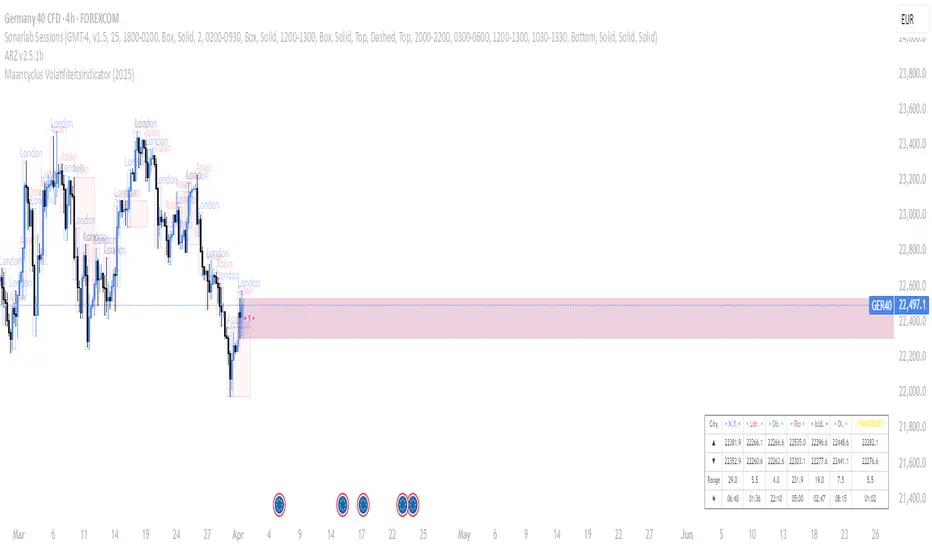
This Moon Cycle Volatility Indicator for TradingView is designed to help traders track and analyze market volatility around specific lunar phases, namely the Full Moon and New Moon. The indicator marks the dates of these moon phases on the chart and measures volatility using the Average True Range (ATR) indicator, which gauges market price fluctuations.
Key Features:
Moon Phase Markers: The indicator marks the Full Moon and New Moon on the chart using labels. Blue labels are placed below bars for Full Moons, while red labels are placed above bars for New Moons. These markers are based on a manually curated list of moon phase dates for the year 2025.
Volatility Calculation: The indicator calculates market volatility using the ATR (14), which provides a sense of market movement and potential risk. Volatility is plotted as histograms, with blue histograms representing volatility around Full Moons and red histograms around New Moons.
Comparative Analysis: By comparing the volatility around these moon phases to the average volatility, traders can spot potential patterns or heightened market movements. This can inform trading strategies, such as anticipating increased market activity around specific lunar events.
In essence, this tool helps traders identify potential high-volatility periods tied to lunar cycles, which could impact market sentiment and price action.
סקריפט קוד פתוח
ברוח האמיתית של TradingView, יוצר הסקריפט הזה הפך אותו לקוד פתוח, כך שסוחרים יוכלו לעיין בו ולאמת את פעולתו. כל הכבוד למחבר! אמנם ניתן להשתמש בו בחינם, אך זכור כי פרסום חוזר של הקוד כפוף ל־כללי הבית שלנו.
כתב ויתור
המידע והפרסומים אינם מיועדים להיות, ואינם מהווים, ייעוץ או המלצה פיננסית, השקעתית, מסחרית או מכל סוג אחר המסופקת או מאושרת על ידי TradingView. קרא עוד ב־תנאי השימוש.