OPEN-SOURCE SCRIPT
Money Flow Intensity

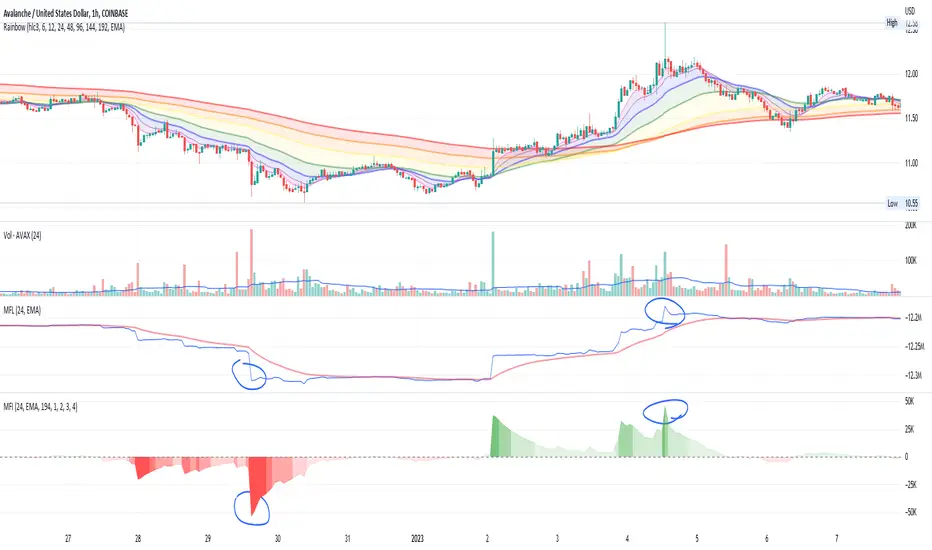
This indicator works very similarly to Elder's Force Index (EFI) and builds on top of what I have for the Money Flow Line (see my other scripts). It combines price movements with volume to create sort of "dollar flow" pressure up and down, looking for "smart money" ("big money") to make their move.
The indicator uses a lookback period to calculate a standard deviation of the movement intensity, then creates gradients to visualize how intense the movement is relative to other movements. This helps measure the pull away from the average more easily than with the Money Flow Line alone.
Much like with EFI, high intensity moves can indicate two things:
1. Strength and conviction in the current direction OR...
2. A reversal is coming soon
You can also watch for waning volume in the current direction, indicating that a trend is losing interest and may be due for a pullback.
There is no way to know, but combining this with price action and a trend indicator can help give you some good educated guesses about what could happen next. Combine with averaging in or out and managing risk appropriately. Good luck :)
סקריפט קוד פתוח
ברוח האמיתית של TradingView, יוצר הסקריפט הזה הפך אותו לקוד פתוח, כך שסוחרים יוכלו לעיין בו ולאמת את פעולתו. כל הכבוד למחבר! אמנם ניתן להשתמש בו בחינם, אך זכור כי פרסום חוזר של הקוד כפוף ל־כללי הבית שלנו.
כתב ויתור
המידע והפרסומים אינם מיועדים להיות, ואינם מהווים, ייעוץ או המלצה פיננסית, השקעתית, מסחרית או מכל סוג אחר המסופקת או מאושרת על ידי TradingView. קרא עוד ב־תנאי השימוש.