OPEN-SOURCE SCRIPT
מעודכן VPA Volume Price Average
Description:
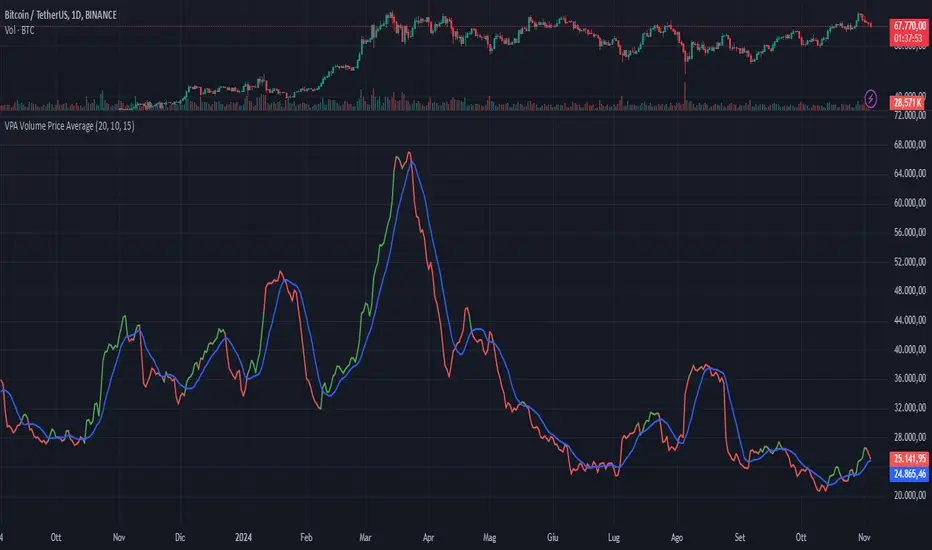
This indicator displays a moving average of volume and its signal line in a separate pane, with conditional highlighting to help interpret buyer and seller pressure. It’s based on two main lines:
Volume Moving Average (red line): represents the average volume calculated over a configurable number of periods.
Signal Line of the Volume Moving Average (blue line): this is an average of the volume moving average itself, used as a reference for volume trends.
Key Features
Volume Moving Average with Conditional Highlighting:
The volume moving average is plotted as a red line and changes color based on two specific conditions:
The closing price is above its moving average, calculated over a configurable number of periods, indicating a bullish trend.
The volume moving average is greater than the signal line, suggesting an increase in buyer pressure.
When both conditions are met, the volume moving average turns green. If one or both conditions are not met, the line remains red.
Signal Line of the Volume Moving Average:
The signal line is plotted in blue and represents a smoothed version of the volume moving average, useful for identifying long-term volume trends and as a reference for the highlighting condition.
Customizable Periods
The indicator allows you to set the periods for each average to adapt to different timeframes and desired sensitivity:
Period for calculating the volume moving average.
Period for calculating the signal line of the volume moving average.
Period for the price moving average (used in the highlighting condition).
How to Use
This indicator is especially useful for monitoring volume dynamics in detail, with a visual system that highlights conditions of increasing buyer strength when the price is in an uptrend. The green highlight on the volume moving average provides an intuitive signal for identifying potential moments of buyer support.
Try it to gain a clearer and more focused view of volume behavior relative to price movement!
הערות שחרור
Description:This indicator displays a moving average of volume and its signal line in a separate pane, with conditional highlighting to help interpret buyer and seller pressure. It’s based on two main lines:
Volume Moving Average (red line): represents the average volume calculated over a configurable number of periods.
Signal Line of the Volume Moving Average (blue line): this is an average of the volume moving average itself, used as a reference for volume trends.
Key Features
Volume Moving Average with Conditional Highlighting:
The volume moving average is plotted as a red line and changes color based on two specific conditions:
The closing price is above its moving average, calculated over a configurable number of periods, indicating a bullish trend.
The volume moving average is greater than the signal line, suggesting an increase in buyer pressure.
When both conditions are met, the volume moving average turns green. If one or both conditions are not met, the line remains red.
Signal Line of the Volume Moving Average:
The signal line is plotted in blue and represents a smoothed version of the volume moving average, useful for identifying long-term volume trends and as a reference for the highlighting condition.
Customizable Periods
The indicator allows you to set the periods for each average to adapt to different timeframes and desired sensitivity:
Period for calculating the volume moving average.
Period for calculating the signal line of the volume moving average.
Period for the price moving average (used in the highlighting condition).
How to Use
This indicator is especially useful for monitoring volume dynamics in detail, with a visual system that highlights conditions of increasing buyer strength when the price is in an uptrend. The green highlight on the volume moving average provides an intuitive signal for identifying potential moments of buyer support.
Try it to gain a clearer and more focused view of volume behavior relative to price movement!
סקריפט קוד פתוח
ברוח האמיתית של TradingView, יוצר הסקריפט הזה הפך אותו לקוד פתוח, כך שסוחרים יוכלו לעיין בו ולאמת את פעולתו. כל הכבוד למחבר! אמנם ניתן להשתמש בו בחינם, אך זכור כי פרסום חוזר של הקוד כפוף ל־כללי הבית שלנו.
כתב ויתור
המידע והפרסומים אינם מיועדים להיות, ואינם מהווים, ייעוץ או המלצה פיננסית, השקעתית, מסחרית או מכל סוג אחר המסופקת או מאושרת על ידי TradingView. קרא עוד ב־תנאי השימוש.