INVITE-ONLY SCRIPT
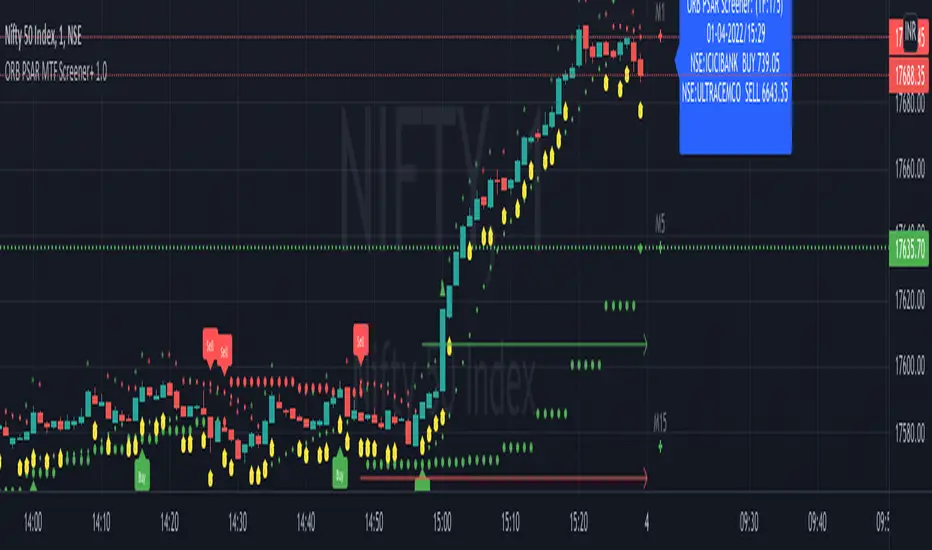
ORB PSAR MTF Screener+ 1.0

The parabolic SAR is a technical indicator used to determine the price direction of an asset, as well as draw attention to when the price direction is changing.
Sometimes known as the "stop and reversal system," the parabolic SAR was developed by J. Welles Wilder Jr., creator of the relative strength index (RSI).
PSAR can itself prove to be great trading strategy if it is used on a multiple timeframe.
This indicator contains the followings:
1. A Screener to process multiple stocks at one go to show possible trades
2. MTF plotting of trading signals for individual stocks as well as list of stocks
3. Alert system to inform you of possible trade setups
4. Auto selection of best MTF for trades
5. Strength Candle markings.
6. Configurable options to customise as per your need.
The indicator works on the 1 Min, 5Min, 30Min, 1Hr, 4Hr, Daily, Monthly setups.
Due to TradingView restrictions and MTF usages, the screener can process a list of only 14 symbols. However , you can use the alerts option to define multiple lists of 14 stocks.
Enjoy!
סקריפט להזמנה בלבד
הגישה לסקריפט זה מוגבלת למשתמשים שהוסמכו על ידי הכותב ובדרך כלל דורשת תשלום. אתה יכול להוסיף אותו למועדפים שלך, אך תוכל להשתמש בו רק לאחר שתבקש אישור ותקבל אותו מהמחבר שלו. למידע נוסף, צור קשר עם Gann_Academy, או עקוב אחר הוראות המחבר למטה.
TradingView לא מציעה לשלם עבור סקריפט ולהשתמש בו אלא אם כן אתה סומך ב-100% על המחבר שלו ומבין כיצד הסקריפט עובד. במקרים רבים, אתה יכול למצוא אלטרנטיבה טובה לקוד פתוח בחינם בבסקריפטים הקהילתיים שלנו.
הוראות המחבר
″To access this indicator, you can DM on TradingView for details.
רוצה להשתמש בסקריפ זה בגרף?
אזהרה: נא לקרוא לפני בקשת גישה.
כתב ויתור
המידע והפרסומים אינם אמורים להיות, ואינם מהווים, עצות פיננסיות, השקעות, מסחר או סוגים אחרים של עצות או המלצות שסופקו או מאושרים על ידי TradingView. קרא עוד בתנאים וההגבלות.