OPEN-SOURCE SCRIPT
Dot trader
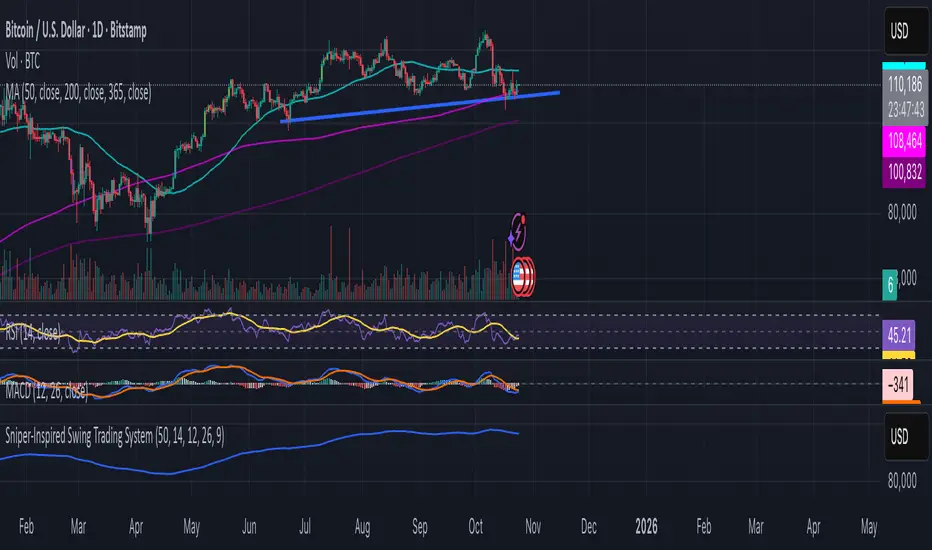
Interpret Signals: Green triangles indicate buy (e.g., if BTC holds $109k with bullish crossover); red triangles indicate sell (e.g., if it breaks $108k with bearish divergence).
Candle Colors: Green/bullish, red/bearish, orange/overbought (>70 RSI), blue/oversold (<30 RSI).
Alerts: Enable in TradingView for real-time notifications.
Candle Colors: Green/bullish, red/bearish, orange/overbought (>70 RSI), blue/oversold (<30 RSI).
Alerts: Enable in TradingView for real-time notifications.
סקריפט קוד פתוח
ברוח האמיתית של TradingView, יוצר הסקריפט הזה הפך אותו לקוד פתוח, כך שסוחרים יוכלו לעיין בו ולאמת את פעולתו. כל הכבוד למחבר! אמנם ניתן להשתמש בו בחינם, אך זכור כי פרסום חוזר של הקוד כפוף ל־כללי הבית שלנו.
כתב ויתור
המידע והפרסומים אינם מיועדים להיות, ואינם מהווים, ייעוץ או המלצה פיננסית, השקעתית, מסחרית או מכל סוג אחר המסופקת או מאושרת על ידי TradingView. קרא עוד ב־תנאי השימוש.