OPEN-SOURCE SCRIPT
Expected Daily Range @shrilss

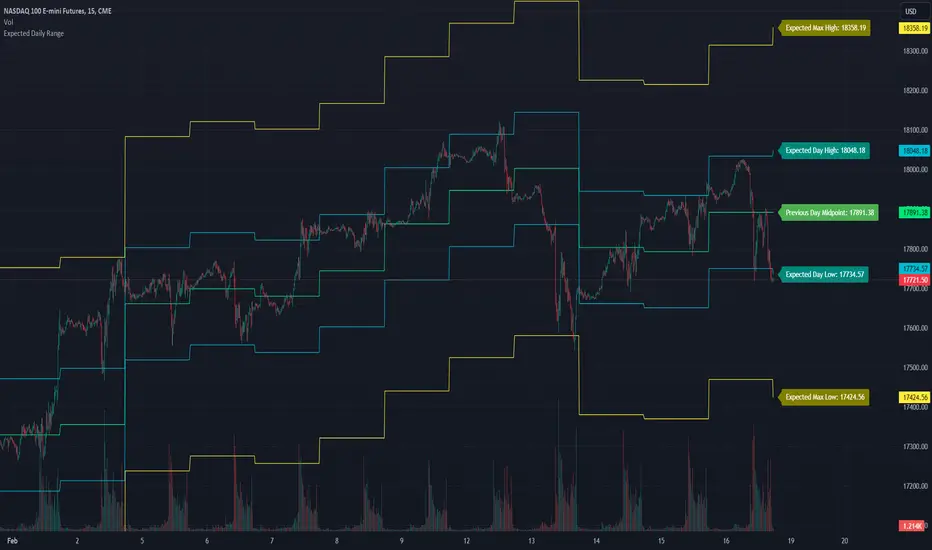
This indicator provides traders with insights into potential price movements based on statistical analysis of historical data. It calculates expected high and low price levels for the current trading day, as well as maximum expected high and low levels, aiding traders in setting appropriate entry and exit points.
This indicator utilizes the previous day's open and close prices to establish a midpoint, around which the expected price range is calculated. By factoring in a user-defined standard deviation multiplier, traders can adjust the sensitivity of the expected price levels to market volatility.
The script plots the previous day's midpoint, along with the expected high and low price levels for the current day. Additionally, it offers insights into potential maximum price fluctuations by plotting the maximum expected high and low levels.
סקריפט קוד פתוח
ברוח האמיתית של TradingView, יוצר הסקריפט הזה הפך אותו לקוד פתוח, כך שסוחרים יוכלו לעיין בו ולאמת את פעולתו. כל הכבוד למחבר! אמנם ניתן להשתמש בו בחינם, אך זכור כי פרסום חוזר של הקוד כפוף ל־כללי הבית שלנו.
כתב ויתור
המידע והפרסומים אינם מיועדים להיות, ואינם מהווים, ייעוץ או המלצה פיננסית, השקעתית, מסחרית או מכל סוג אחר המסופקת או מאושרת על ידי TradingView. קרא עוד ב־תנאי השימוש.