OPEN-SOURCE SCRIPT
מעודכן RSI true swings

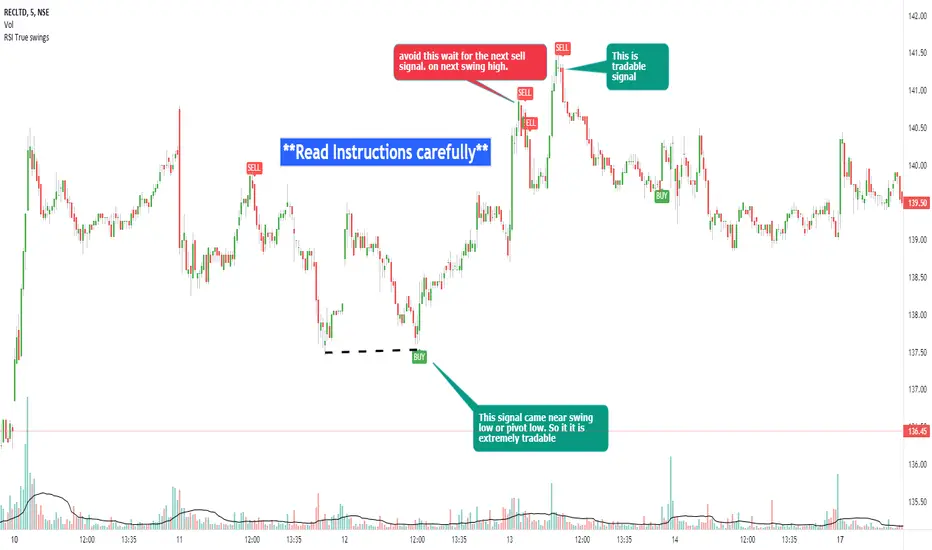
Relative Strength Index (RSI) is being used by majority of the traders to get benefitted based on the swings. But these swings are hard to Identify.
This Indicator uses 4 major factors for finding the potential reversal points:
Please read Instructions carefully before using this indicator
* Recommended entry is the OHLC4 of the signal bars.
* If signal bar is too large, try to enter in the retracement when another signal comes either through indicator or through types of bars
* when signals comes opposite to the trend, then try to wait for the next signal of same type. This creates a RSI-price divergence in confirmation by volume price action
* Timeframe can be of your choice
Recommended stoploss should be swing highs or lows
This Indicator uses 4 major factors for finding the potential reversal points:
- * RSI Crossover or crossunder
* Relative volume
* Overall volume against the moving average volume
* Relative closing of the candles
* Size of the bars
Please read Instructions carefully before using this indicator
* Recommended entry is the OHLC4 of the signal bars.
* If signal bar is too large, try to enter in the retracement when another signal comes either through indicator or through types of bars
* when signals comes opposite to the trend, then try to wait for the next signal of same type. This creates a RSI-price divergence in confirmation by volume price action
* Timeframe can be of your choice
Recommended stoploss should be swing highs or lows
הערות שחרור
- Removed gap down and gap up moves
- Removed cases where there was sudden volatile in RSi values
- Refined criteria of healthy bar
הערות שחרור
Previous bar condition on RSI is updatedהערות שחרור
Alerts are added!!הערות שחרור
Updated!הערות שחרור
updated alerts!סקריפט קוד פתוח
ברוח האמיתית של TradingView, יוצר הסקריפט הזה הפך אותו לקוד פתוח, כך שסוחרים יוכלו לעיין בו ולאמת את פעולתו. כל הכבוד למחבר! אמנם ניתן להשתמש בו בחינם, אך זכור כי פרסום חוזר של הקוד כפוף ל־כללי הבית שלנו.
כתב ויתור
המידע והפרסומים אינם מיועדים להיות, ואינם מהווים, ייעוץ או המלצה פיננסית, השקעתית, מסחרית או מכל סוג אחר המסופקת או מאושרת על ידי TradingView. קרא עוד ב־תנאי השימוש.
סקריפט קוד פתוח
ברוח האמיתית של TradingView, יוצר הסקריפט הזה הפך אותו לקוד פתוח, כך שסוחרים יוכלו לעיין בו ולאמת את פעולתו. כל הכבוד למחבר! אמנם ניתן להשתמש בו בחינם, אך זכור כי פרסום חוזר של הקוד כפוף ל־כללי הבית שלנו.
כתב ויתור
המידע והפרסומים אינם מיועדים להיות, ואינם מהווים, ייעוץ או המלצה פיננסית, השקעתית, מסחרית או מכל סוג אחר המסופקת או מאושרת על ידי TradingView. קרא עוד ב־תנאי השימוש.