OPEN-SOURCE SCRIPT
Volume candle by Moond
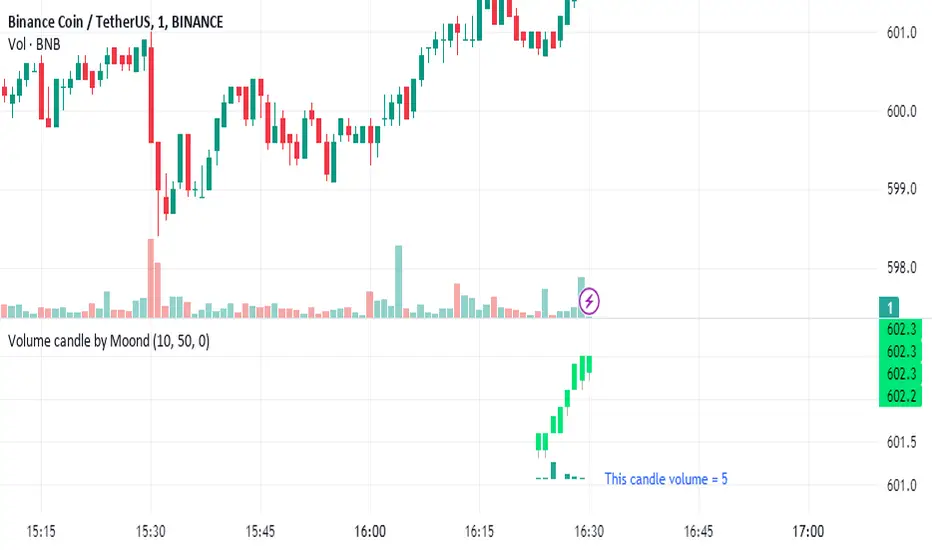
Indicator Description: Equal Volume Candle Chart
This indicator creates a real-time candlestick chart where each candle forms upon the completion of a specific volume threshold, rather than within fixed time intervals. The candles update dynamically based on the total volume traded, providing a unique perspective that incorporates market activity directly into price movements.
Key Features:
Dynamic Candles Based on Volume: Candles form when a defined lot size of volume is reached, making each candle represent consistent trading activity rather than a fixed time period.
Customizable Volume Lot Size: Users can easily adjust the volume threshold to suit different trading styles or asset classes.
Real-Time Market Reflection: The chart responds to changes in market volume, offering a clearer view of market intensity and momentum.
Concept Behind the Indicator: Traditional candlestick charts operate on time intervals, which can ignore the influence of volume in price changes. By basing the candle formation on equal volumes, this indicator integrates both price and traded volume into the visual representation, helping traders capture key shifts in market sentiment and activity that might be missed on time-based charts
סקריפט קוד פתוח
ברוח האמיתית של TradingView, יוצר הסקריפט הזה הפך אותו לקוד פתוח, כך שסוחרים יוכלו לעיין בו ולאמת את פעולתו. כל הכבוד למחבר! אמנם ניתן להשתמש בו בחינם, אך זכור כי פרסום חוזר של הקוד כפוף ל־כללי הבית שלנו.
כתב ויתור
המידע והפרסומים אינם מיועדים להיות, ואינם מהווים, ייעוץ או המלצה פיננסית, השקעתית, מסחרית או מכל סוג אחר המסופקת או מאושרת על ידי TradingView. קרא עוד ב־תנאי השימוש.