OPEN-SOURCE SCRIPT
12 Weeks of Weekly Levels
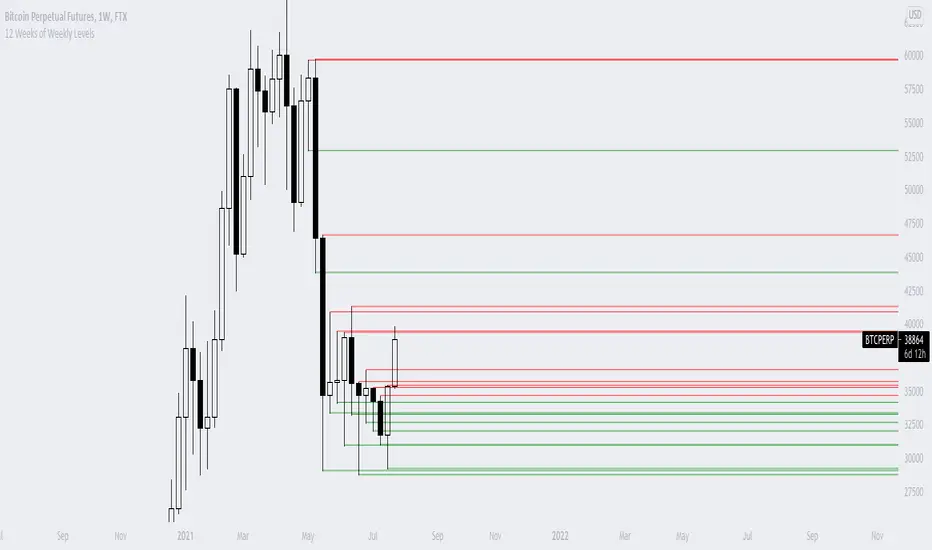
A very simple indicator, which basically looks back on the past 12 weeks at 8PM EST and finds the highs and the lows. Once it finds those levels, it draws them as horizontal rays on the chart. The lows are drawn in green (to indicate previous buy zones) and the highs in red (to indicate previous sell zones). No user inputs are required
Nothing fancy, just weekly levels for the past quarter. You can easily draw these on a chart yourself, but it becomes very time consuming if you are watching a bunch of instruments and then Sundays come around.
Special shoutout to rumpypumpydumpy on StackOverflow for helping me work out the kinks, this is the first indicator I ever created. Hope it helps you find confluence in your decision making
סקריפט קוד פתוח
ברוח האמיתית של TradingView, יוצר הסקריפט הזה הפך אותו לקוד פתוח, כך שסוחרים יוכלו לעיין בו ולאמת את פעולתו. כל הכבוד למחבר! אמנם ניתן להשתמש בו בחינם, אך זכור כי פרסום חוזר של הקוד כפוף ל־כללי הבית שלנו.
כתב ויתור
המידע והפרסומים אינם מיועדים להיות, ואינם מהווים, ייעוץ או המלצה פיננסית, השקעתית, מסחרית או מכל סוג אחר המסופקת או מאושרת על ידי TradingView. קרא עוד ב־תנאי השימוש.