Crypto Money Flow Ratio
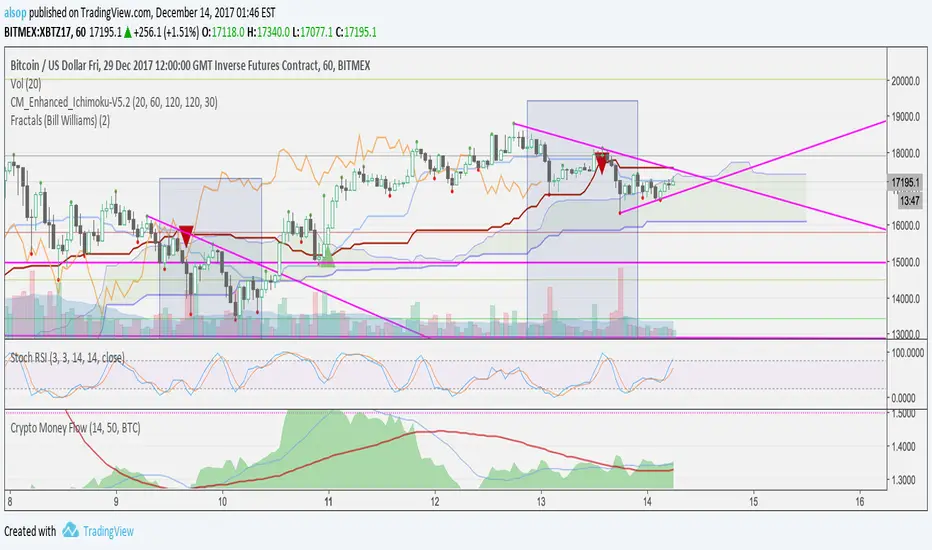
In this example, there are two moving averages applied to the indicator (at the bottom). Once the Fast crosses the Slow and the area is above both - this tells you the major market players are accumulating and you should be looking to long.
In addition, Stochastic RSI is also oversold and Ichimoku shows price above the cloud - all confluence on a long trade. As you can see, in the next hour price rocketed.
This size of move isn't always common, and this move may have been due to news. Even if so, people were aware and started buying and you could see it happen.
Another example here with DASH.
In this example, you can see there was a previous bull move that we applied a fib to and had a 38% retracement. We bought on the indicator cross and ratio above averages with a target of a 38% extension. It hit almost exactly and we closed out.
To apply this to other currencies, change the settings. For example, for ETHUSD - change the setting from BTC to ETH.
סקריפט להזמנה בלבד
רק משתמשים שאושרו על ידי המחבר יכולים לגשת לסקריפט הזה. יהיה עליך לשלוח בקשת גישה ולקבל אישור לשימוש. בדרך כלל, הגישה ניתנת לאחר תשלום. למידע נוסף, עקוב אחר ההוראות של היוצר בהמשך או צור קשר עם alsop ישירות.
TradingView לא ממליצה לשלם עבור סקריפט או להשתמש בו אלא אם כן אתה סומך לחלוטין על המחבר שלו ומבין כיצד הוא פועל. ייתכן שתוכל גם למצוא חלופות חינמיות וקוד פתוח ב-סקריפטים הקהילתיים שלנו.
הוראות המחבר
כתב ויתור
סקריפט להזמנה בלבד
רק משתמשים שאושרו על ידי המחבר יכולים לגשת לסקריפט הזה. יהיה עליך לשלוח בקשת גישה ולקבל אישור לשימוש. בדרך כלל, הגישה ניתנת לאחר תשלום. למידע נוסף, עקוב אחר ההוראות של היוצר בהמשך או צור קשר עם alsop ישירות.
TradingView לא ממליצה לשלם עבור סקריפט או להשתמש בו אלא אם כן אתה סומך לחלוטין על המחבר שלו ומבין כיצד הוא פועל. ייתכן שתוכל גם למצוא חלופות חינמיות וקוד פתוח ב-סקריפטים הקהילתיים שלנו.