OPEN-SOURCE SCRIPT
Ali Perşembenin kitaplarından esinlenerek indikatör takibi.
## How to Use – Scoring-Based Detailed Analysis Panel
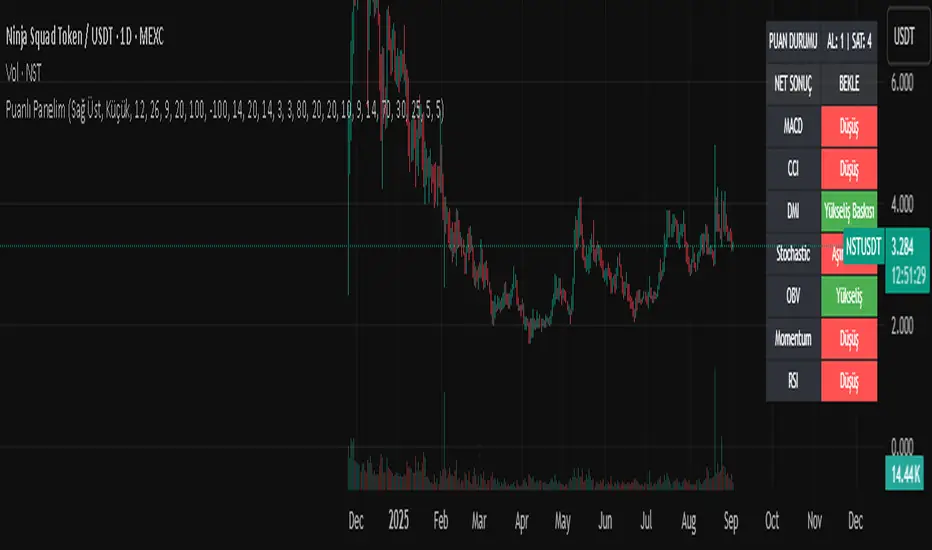
This indicator provides a **comprehensive scoring system** by combining multiple technical indicators. It helps traders quickly assess whether the market is leaning bullish, bearish, or neutral, and displays the result in a **visual table panel**.
---
### 📊 What It Does
* Monitors **7 popular indicators** (MACD, CCI, DMI, Stochastic, OBV, Momentum, RSI)
* Assigns **bullish or bearish points** depending on indicator conditions
* Detects **divergences (MACD & RSI)** and adds them into the score
* Calculates a **final net score** and provides a suggestion:
* **BUY** (if score ≥ Buy threshold)
* **SELL** (if score ≤ –Sell threshold)
* **WAIT** (otherwise)
* Results are displayed in a **customizable panel** (position & size).
---
### ⚙️ Settings
* **Show/Hide Indicators** – Choose which indicators to include in scoring
* **Parameters** – Adjust lengths, thresholds, and levels individually
* **Scoring Thresholds** – Define how many points are required for BUY/SELL signals
* **Table Options** – Change panel position and text size for easier readability
---
### 🧮 Indicator Purposes
Each indicator serves a different role in technical analysis:
* **MACD (Moving Average Convergence Divergence):** Measures trend direction and momentum. Bullish when MACD line crosses above the signal line, bearish when below.
* **CCI (Commodity Channel Index):** Detects overbought/oversold levels and potential reversals. Values above +100 suggest overbought, below –100 oversold.
* **DMI / ADX (Directional Movement Index):** Identifies whether the market is trending and if bulls or bears are stronger. ADX confirms trend strength.
* **Stochastic Oscillator:** Compares closing price to price range over time. Indicates overbought (>80) or oversold (<20) and generates buy/sell crossovers.
* **OBV (On-Balance Volume):** Tracks volume flow to confirm price trends. Rising OBV suggests accumulation (bullish), falling OBV suggests distribution (bearish).
* **Momentum:** Measures the speed of price changes. Increasing momentum suggests strengthening trend; decreasing momentum indicates weakening.
* **RSI (Relative Strength Index):** Identifies overbought (>70) or oversold (<30) conditions, as well as trend direction around the 50 line. Divergences often signal reversals.
---
### ✅ How to Use
1. Apply the indicator to your chart.
2. Check the **panel on the right** for current bullish vs bearish scores.
3. Watch the **final signal (BUY, SELL, or WAIT)** as a quick market overview.
4. Always combine with **price action, support/resistance, and your own strategy** for confirmation.
---
### ⚠️ Disclaimer
This indicator is for **educational and informational purposes only**.
It is **not financial advice** and does not guarantee profits. Use proper risk management and test thoroughly before trading live.
---
סקריפט קוד פתוח
ברוח TradingView אמיתית, היוצר של הסקריפט הזה הפך אותו לקוד פתוח, כך שסוחרים יכולים לבדוק ולאמת את הפונקציונליות שלו. כל הכבוד למחבר! למרות שאתה יכול להשתמש בו בחינם, זכור שפרסום מחדש של הקוד כפוף לכללי הבית שלנו.
כתב ויתור
המידע והפרסומים אינם אמורים להיות, ואינם מהווים, עצות פיננסיות, השקעות, מסחר או סוגים אחרים של עצות או המלצות שסופקו או מאושרים על ידי TradingView. קרא עוד בתנאים וההגבלות.