PROTECTED SOURCE SCRIPT
Triple-CandleStick-Strategy (AKA : TCS)
Triple Candlestick Strategy
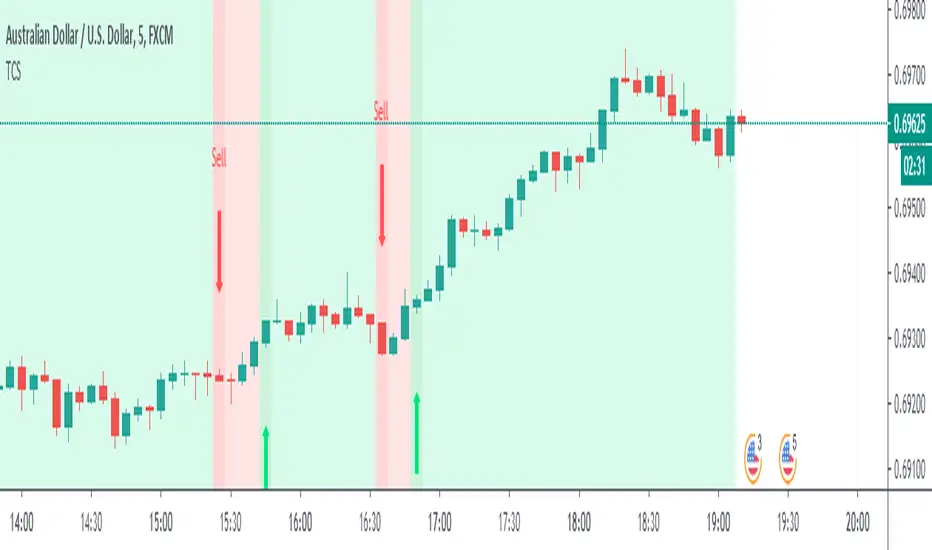
An indicator that helps us to evaluate current and future possible price direction through the background colors. Green for bullish and Red for a bearish market. This indicator shoots signals either long or short depending on which direction the triple candlestick pattern is formed. Three candles up will fire a long signal while three candles down a short signal. The light-dark shaded background color with arrows (either up or down) is the new entry at the certain direction of the market for the chosen symbol (in our case AUDUSD). Useful for glance view of overall market sentiment and one can use alert features for getting aware of the situation.
An indicator that helps us to evaluate current and future possible price direction through the background colors. Green for bullish and Red for a bearish market. This indicator shoots signals either long or short depending on which direction the triple candlestick pattern is formed. Three candles up will fire a long signal while three candles down a short signal. The light-dark shaded background color with arrows (either up or down) is the new entry at the certain direction of the market for the chosen symbol (in our case AUDUSD). Useful for glance view of overall market sentiment and one can use alert features for getting aware of the situation.
סקריפט מוגן
סקריפט זה פורסם כמקור סגור. עם זאת, תוכל להשתמש בו בחופשיות וללא כל מגבלות – למד עוד כאן
כתב ויתור
המידע והפרסומים אינם מיועדים להיות, ואינם מהווים, ייעוץ או המלצה פיננסית, השקעתית, מסחרית או מכל סוג אחר המסופקת או מאושרת על ידי TradingView. קרא עוד ב־תנאי השימוש.
סקריפט מוגן
סקריפט זה פורסם כמקור סגור. עם זאת, תוכל להשתמש בו בחופשיות וללא כל מגבלות – למד עוד כאן
כתב ויתור
המידע והפרסומים אינם מיועדים להיות, ואינם מהווים, ייעוץ או המלצה פיננסית, השקעתית, מסחרית או מכל סוג אחר המסופקת או מאושרת על ידי TradingView. קרא עוד ב־תנאי השימוש.