OPEN-SOURCE SCRIPT
Liquidity Index with Advanced Statistical Normalization
Liquidity Index with Advanced Statistical Normalization
An open-source TradingView indicator for analyzing global liquidity cycles using robust statistical methods
Overview
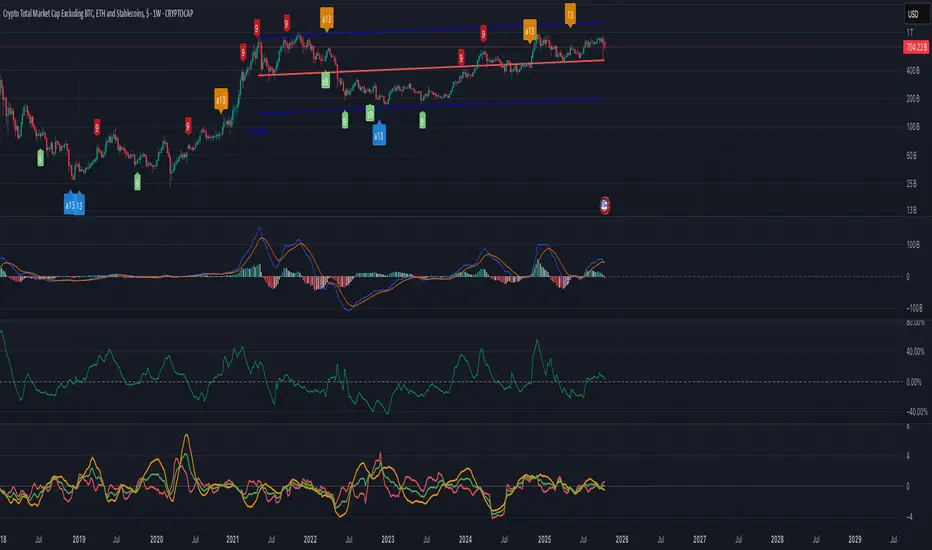
This Pine Script indicator combines multiple macroeconomic data sources to construct a composite liquidity index that tracks global financial conditions. It employs advanced statistical techniques typically found in quantitative finance research, adapted for real-time charting.
Key Features
📊 Multi-Source Data Integration
- Federal Reserve Components: Fed Funds Rate, Reverse Repo (RRP), Treasury General Account (TGA)
- PBOC Components: China M2 Money Stock adjusted by CNY/USD exchange rate
- Volatility Index: MOVE Index (bond market volatility)
🔬 Advanced Statistical Methods
1. Theil-Sen Estimator: Robust trend detection resistant to outliers
2. Triple Normalization:
- Z-score normalization
- MAD (Median Absolute Deviation) normalization
- Quantile normalization via inverse normal CDF
3. Multi-Timeframe Analysis: Short (8-bar) and long (34-bar) windows with blended composite
📈 Signal Processing
- Log-transformation for non-linear relationships
- Smoothing via customizable SMA
- Composite signal averaging across normalization methods
Why This Approach?
Traditional liquidity indicators often suffer from:
- Sensitivity to outliers in economic data
- Assumption of normal distributions
- Single-timeframe bias
This script addresses these issues by:
- Using median-based robust statistics (Theil-Sen, MAD)
- Applying multiple normalization techniques
- Blending short and long-term perspectives
Customization Options
short_length // Short window (default: 8)
long_length // Long window (default: 34)
show_short // Display short composite
show_long // Display long composite
show_blended // Display blended signal
smoothing_length // SMA smoothing period (default: 10)
How to Use
1. Liquidity Expansion (positive values): Risk-on environment, favorable for asset prices
2. Liquidity Contraction (negative values): Risk-off environment, potential market stress
3. Divergences: Compare indicator direction vs. price action for early warnings
Potential Improvements
Community members are encouraged to enhance:
- Additional data sources (ECB balance sheet, BOJ operations, etc.)
- Alternative normalization methods (robust scaling, rank transformation)
- Machine learning integration (LSTM forecasting, regime detection)
- Alert conditions for liquidity inflection points
- Volatility-adjusted weighting schemes
Technical Notes
- Uses request.security() for multi-symbol data fetching
- All calculations handle missing data via nz() functions
- Median-based statistics computed via array operations
- Custom inverse CDF approximation (no external libraries required)
Contributing
This is a foundation for liquidity analysis. Potential extensions:
- LLM Integration: Use language models to parse Fed/PBOC meeting minutes and adjust weights dynamically
- Sentiment Layer: Incorporate crypto funding rates or options skew
- Adaptive Parameters: Auto-tune window lengths based on market regime
- Cross-Asset Validation: Backtest signals against BTC, equities, bonds
---
License: Open source - modify and redistribute freelyDisclaimer: For educational purposes only. Not financial advice.
An open-source TradingView indicator for analyzing global liquidity cycles using robust statistical methods
Overview
This Pine Script indicator combines multiple macroeconomic data sources to construct a composite liquidity index that tracks global financial conditions. It employs advanced statistical techniques typically found in quantitative finance research, adapted for real-time charting.
Key Features
📊 Multi-Source Data Integration
- Federal Reserve Components: Fed Funds Rate, Reverse Repo (RRP), Treasury General Account (TGA)
- PBOC Components: China M2 Money Stock adjusted by CNY/USD exchange rate
- Volatility Index: MOVE Index (bond market volatility)
🔬 Advanced Statistical Methods
1. Theil-Sen Estimator: Robust trend detection resistant to outliers
2. Triple Normalization:
- Z-score normalization
- MAD (Median Absolute Deviation) normalization
- Quantile normalization via inverse normal CDF
3. Multi-Timeframe Analysis: Short (8-bar) and long (34-bar) windows with blended composite
📈 Signal Processing
- Log-transformation for non-linear relationships
- Smoothing via customizable SMA
- Composite signal averaging across normalization methods
Why This Approach?
Traditional liquidity indicators often suffer from:
- Sensitivity to outliers in economic data
- Assumption of normal distributions
- Single-timeframe bias
This script addresses these issues by:
- Using median-based robust statistics (Theil-Sen, MAD)
- Applying multiple normalization techniques
- Blending short and long-term perspectives
Customization Options
short_length // Short window (default: 8)
long_length // Long window (default: 34)
show_short // Display short composite
show_long // Display long composite
show_blended // Display blended signal
smoothing_length // SMA smoothing period (default: 10)
How to Use
1. Liquidity Expansion (positive values): Risk-on environment, favorable for asset prices
2. Liquidity Contraction (negative values): Risk-off environment, potential market stress
3. Divergences: Compare indicator direction vs. price action for early warnings
Potential Improvements
Community members are encouraged to enhance:
- Additional data sources (ECB balance sheet, BOJ operations, etc.)
- Alternative normalization methods (robust scaling, rank transformation)
- Machine learning integration (LSTM forecasting, regime detection)
- Alert conditions for liquidity inflection points
- Volatility-adjusted weighting schemes
Technical Notes
- Uses request.security() for multi-symbol data fetching
- All calculations handle missing data via nz() functions
- Median-based statistics computed via array operations
- Custom inverse CDF approximation (no external libraries required)
Contributing
This is a foundation for liquidity analysis. Potential extensions:
- LLM Integration: Use language models to parse Fed/PBOC meeting minutes and adjust weights dynamically
- Sentiment Layer: Incorporate crypto funding rates or options skew
- Adaptive Parameters: Auto-tune window lengths based on market regime
- Cross-Asset Validation: Backtest signals against BTC, equities, bonds
---
License: Open source - modify and redistribute freelyDisclaimer: For educational purposes only. Not financial advice.
סקריפט קוד פתוח
ברוח האמיתית של TradingView, יוצר הסקריפט הזה הפך אותו לקוד פתוח, כך שסוחרים יוכלו לעיין בו ולאמת את פעולתו. כל הכבוד למחבר! אמנם ניתן להשתמש בו בחינם, אך זכור כי פרסום חוזר של הקוד כפוף ל־כללי הבית שלנו.
כתב ויתור
המידע והפרסומים אינם מיועדים להיות, ואינם מהווים, ייעוץ או המלצה פיננסית, השקעתית, מסחרית או מכל סוג אחר המסופקת או מאושרת על ידי TradingView. קרא עוד ב־תנאי השימוש.