OPEN-SOURCE SCRIPT
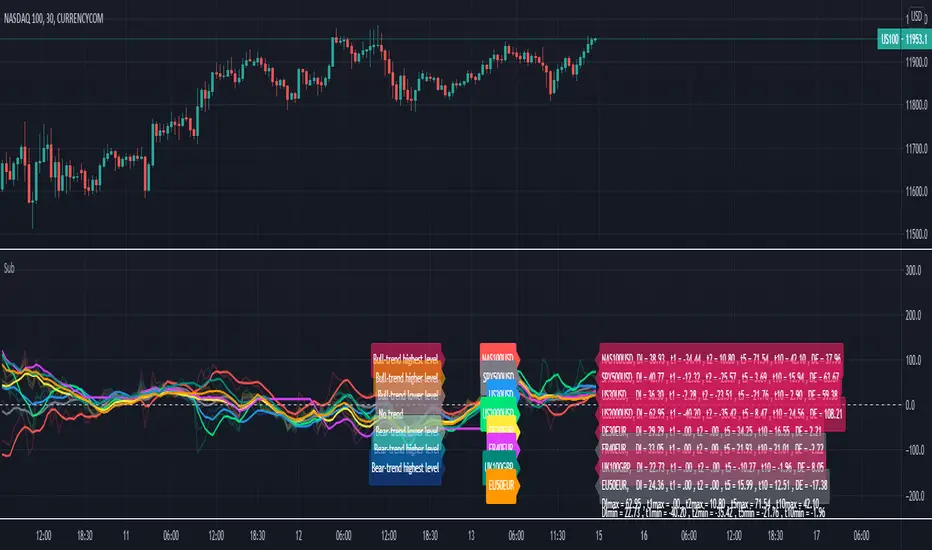
מעודכן Relative Strength Index of EU and US Stock Index Trends quality

//Relative Strength Index of European and US Stock Index Trends quality
//This indicator reveals the relative strength of European and US stock index futures.
//take Bull trend as an example , the current closed price>EMA20 value and the current closed price >20th previous bar closed price( deduction price),
//it's defined as a lower level bull trend .If the current price EMA20>EMA60, it's defined as a higher level bull trend .If the EMA20>EMA60>EMA120,it's defined as the highest level bull trend.
//You can choose to draw the curve with the deviation rate of the original major indexes to 20EMA, or draw the deviation rate with the average value (default value is 5 bars).
//In addition, a more technical method is added to analyze the deviation changes of the major indexes.The deviation rate changing velocity value, parameter tan (abbreviated by t) of 1, 2, 5, 10 is introduced.
//You can have the option of calculate the tan using average value of 5 candlesticks or original value.
//Taking tan1 as an example, it indicates how much the deviation rate between the current price and the previous candlestick has changed.
//The indicator of the index color and the description of the trend quality color can be switched off in option.
//In addition, this code color scheme is only suitable for black background (the code color needs to be changed by yourself if you use white background).
הערות שחרור
Update: Now you can choose your color scheme yourself , which fit white background.Chinese translation:
这个指标主要是为做股指期货/股指差价合约的选手准备的。在之前A股乖离率观察表的代码基础上
1.适配多时间周期,不再需要手动以选项调整时间周期。
2.加入了趋势评分,代码逻辑基本与我发布的变色K线类似。 (因同一script里只能调用40次security函数,目前的趋势评分在初级趋势的条件为(日线上涨为例),现价>EMA20且现价>20天前抵扣价,没有引入现价>SMA20的条件。)
选项里可选择以原本的各大指数与20EMA的乖离率画曲线,或以(默认5根K线的)均值画这个乖离率。
3.加入了更技术的方法去分析各大指数的乖离变化,引入了现价与1、2、5、10根K线前的CS乖离率变化速率参数tan(以t简称),同时这个tan值还可以(默认5根K线的)均值去计算。以t1为例,表示当前价与之前1根K线的乖离率的变化/1 ,t5则为表示当前价与之前5根K线的乖离率的变化/5。
本指标主推趋势打分系统Stock Index C/S trend quality, 同时也保留了之前做的提示符系统Stock Index C/S。
关于指数颜色的标识与趋势强度颜色的说明均线选项中可开关。
הערות שחרור
Update: inspired by john_everist, now you can plot both moving average line and original line at the same time.
סקריפט קוד פתוח
ברוח האמיתית של TradingView, יוצר הסקריפט הזה הפך אותו לקוד פתוח, כך שסוחרים יוכלו לעיין בו ולאמת את פעולתו. כל הכבוד למחבר! אמנם ניתן להשתמש בו בחינם, אך זכור כי פרסום חוזר של הקוד כפוף ל־כללי הבית שלנו.
כתב ויתור
המידע והפרסומים אינם מיועדים להיות, ואינם מהווים, ייעוץ או המלצה פיננסית, השקעתית, מסחרית או מכל סוג אחר המסופקת או מאושרת על ידי TradingView. קרא עוד ב־תנאי השימוש.