OPEN-SOURCE SCRIPT
מעודכן Semafor

Hello Traders!
I have been away for a while but am recovering back gradually! Here is a gift to all of you.
It is based on the much loved ZigZag++ Script
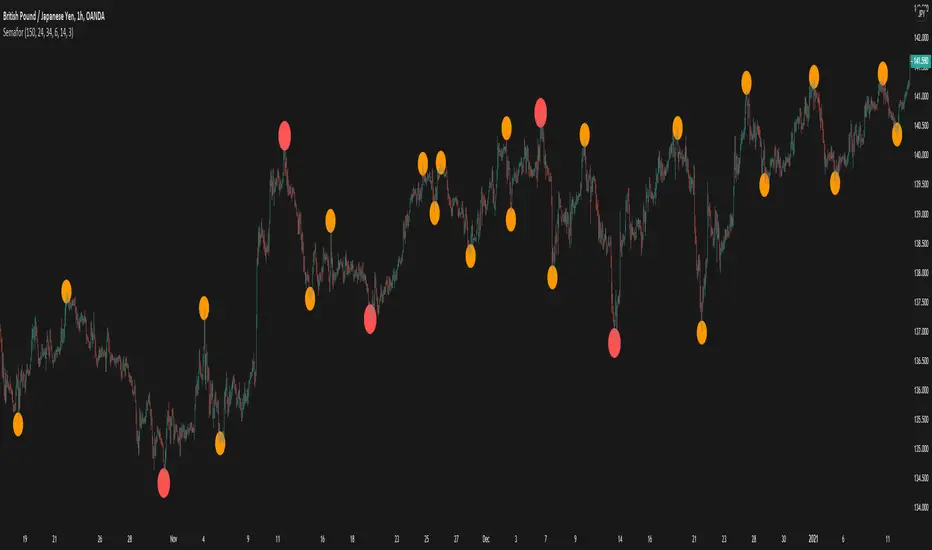
The Semafor is used to spot future multi-level Supports and Resistance zones.
It is also useful to spot HL or LL or HH or LH zones at different Depth settings.
The red zones are the extreme places where the market has a higher chance of reversing while the green zones have the lowest setting with lower chances of the market reversal
To ease understanding of the code, I used the function `zigzag()` to show the simplicity in calculation
More will be coming this Year!
הערות שחרור
Update Request++ Added No Repaint Settings ✔️
++ Added Unique Sizing to Settings ✔️
הערות שחרור
Update Request++ Added Alerts To Confirmed Zones ✔️
++ Added Decimals To Deviation ✔️
סקריפט קוד פתוח
ברוח האמיתית של TradingView, יוצר הסקריפט הזה הפך אותו לקוד פתוח, כך שסוחרים יוכלו לעיין בו ולאמת את פעולתו. כל הכבוד למחבר! אמנם ניתן להשתמש בו בחינם, אך זכור כי פרסום חוזר של הקוד כפוף ל־כללי הבית שלנו.
🤖🤖🤖🤖🤖🤖🤖🤖🤖🤖
Automate TradingView Alerts
tradingview.to?ref=bih
🥰😍😍🥰😍😍🥰😍😍🥰
Automate TradingView Alerts
tradingview.to?ref=bih
🥰😍😍🥰😍😍🥰😍😍🥰
כתב ויתור
המידע והפרסומים אינם מיועדים להיות, ואינם מהווים, ייעוץ או המלצה פיננסית, השקעתית, מסחרית או מכל סוג אחר המסופקת או מאושרת על ידי TradingView. קרא עוד ב־תנאי השימוש.