OPEN-SOURCE SCRIPT
מעודכן Multiple Indicator 50EMA Cross Alerts

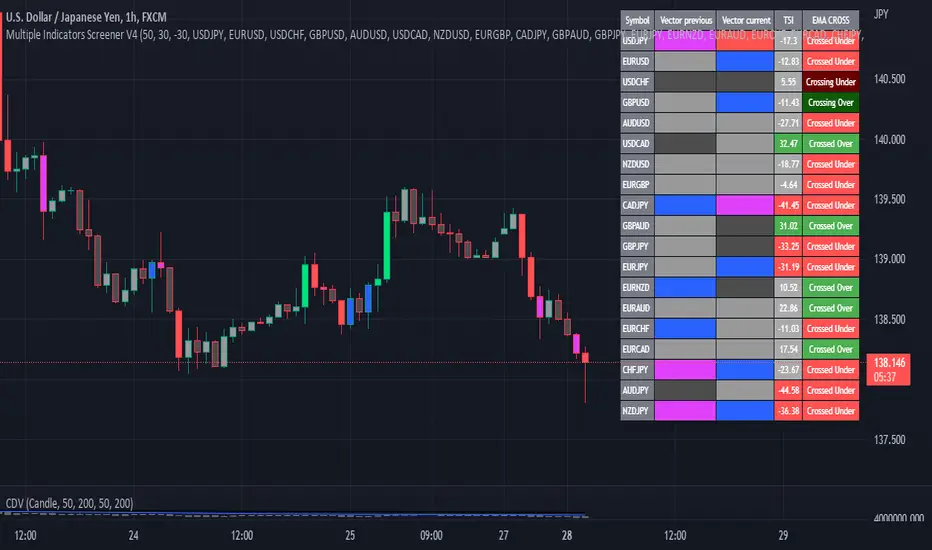
Here’s a screener including Symbol, Price, TSI, and 50 ema cross in a table output.
The 50 Exponential Moving Average is a trend indicator
You can find bullish momentum when the 50 ema crossed over or a bearish momentum when the 50 ema crossed under we are looking to take advantage by trading the reversion of these trends.
True strength index (TSI) is a trend momentum indicator
Readings are bullish when the True Strength Index shows positive values
Readings are bearish when the indicator displays negative values.
When a value is above 20, we look for selling overbought opportunity and when the value is under 20, we look for buying oversold opportunity.
You can select the pair of your choice in the settings.
Make sure to create an alert and choose any alerts then an alert will trigger when a price cross under or cross over the 50 ema for every pair separately.
This allow the user to verify if there is a trade set up or not.
Disclaimer
This post and the script don’t provide any financial advice.
הערות שחרור
The price column as been removed.הערות שחרור
I added crossing under and crossing over in the EMA CROSS column.
I added the Vector Color column from infernixx trader reality version
can be found here :

Description of the Vector Color column
Situation "Climax"
Bars with volume >= 200% of the average volume of the 10 previous chart TFs, and bars
where the product of candle spread x candle volume is >= the highest for the 10 previous
chart time TFs.
Default Colors: Bull bars are green and bear bars are red.
Situation "Volume Rising Above Average"
Bars with volume >= 150% of the average volume of the 10 previous chart TFs.
Default Colors: Bull bars are blue and bear are blue-violet.
I fixed alerts errors
הערות שחרור
I changed the backgroundהערות שחרור
Change in the pairs selectionהערות שחרור
I added a bool to select the candle color from the Trader Reality indicator made by infernixI added input so you can create alert with the ema of your choice.
I added TSI alerts and overbought and oversold input. They are set by default at -30 and 30. You
can change them in the setting. Higher inputs are suitable for crypto.
I added bool input so you can select which alert you want.
Select your input and wait for the indicator to load up. Then create your alert.
Notice that during weekend the indicator needs to be open on a crypto chart. If you open it on a
closed market chart the indicator will not work.
הערות שחרור
Updated the vector candle logicהערות שחרור
Added a bool to choose between previous candle and current candle color or both.הערות שחרור
I added a string that indicate when markets are closed.הערות שחרור
Added alert for color of vectorהערות שחרור
Added alert condition for each vector colorהערות שחרור
Fixed Marketclosed condition. I was not using the correct way to check market closed condition. Note: When you're on a closed market chart, the indicator will show everything as closed market even when they are not. Switch to a chart which the market is open and the indicator will work fine.
סקריפט קוד פתוח
ברוח האמיתית של TradingView, יוצר הסקריפט הזה הפך אותו לקוד פתוח, כך שסוחרים יוכלו לעיין בו ולאמת את פעולתו. כל הכבוד למחבר! אמנם ניתן להשתמש בו בחינם, אך זכור כי פרסום חוזר של הקוד כפוף ל־כללי הבית שלנו.
כתב ויתור
המידע והפרסומים אינם מיועדים להיות, ואינם מהווים, ייעוץ או המלצה פיננסית, השקעתית, מסחרית או מכל סוג אחר המסופקת או מאושרת על ידי TradingView. קרא עוד ב־תנאי השימוש.