OPEN-SOURCE SCRIPT
מעודכן Previous Day Week Highs & Lows

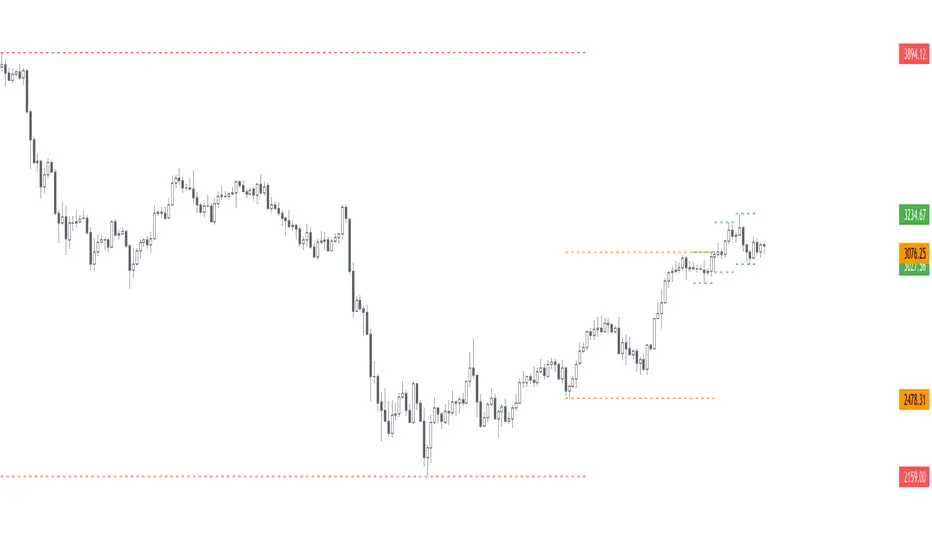
This script plots the previous n day and week highs and lows (previous two days and previous week by default).
Here are some additional info about the script behavior:
Here are some additional info about the script behavior:
- Plots highs and/or lows
- Plots for days and/or weeks
- Day highs and lows are shown only on intraday timeframes
- Week highs and lows are shown only on timeframes < weekly
הערות שחרור
- Add previous month(s) high(s) and low(s)
- Minor fixes and improvements
סקריפט קוד פתוח
ברוח האמיתית של TradingView, יוצר הסקריפט הזה הפך אותו לקוד פתוח, כך שסוחרים יוכלו לעיין בו ולאמת את פעולתו. כל הכבוד למחבר! אמנם ניתן להשתמש בו בחינם, אך זכור כי פרסום חוזר של הקוד כפוף ל־כללי הבית שלנו.
🌟 Listed as "Trusted Pine Programmer"
👨💻 Coding services: sbtnc.dev/hire-pine-script-developer
🔒 Premium indicators: sbtnc.gumroad.com
☕️ Tip: buymeacoffee.com/sbtnc
👨💻 Coding services: sbtnc.dev/hire-pine-script-developer
🔒 Premium indicators: sbtnc.gumroad.com
☕️ Tip: buymeacoffee.com/sbtnc
כתב ויתור
המידע והפרסומים אינם מיועדים להיות, ואינם מהווים, ייעוץ או המלצה פיננסית, השקעתית, מסחרית או מכל סוג אחר המסופקת או מאושרת על ידי TradingView. קרא עוד ב־תנאי השימוש.