PROTECTED SOURCE SCRIPT
GTO
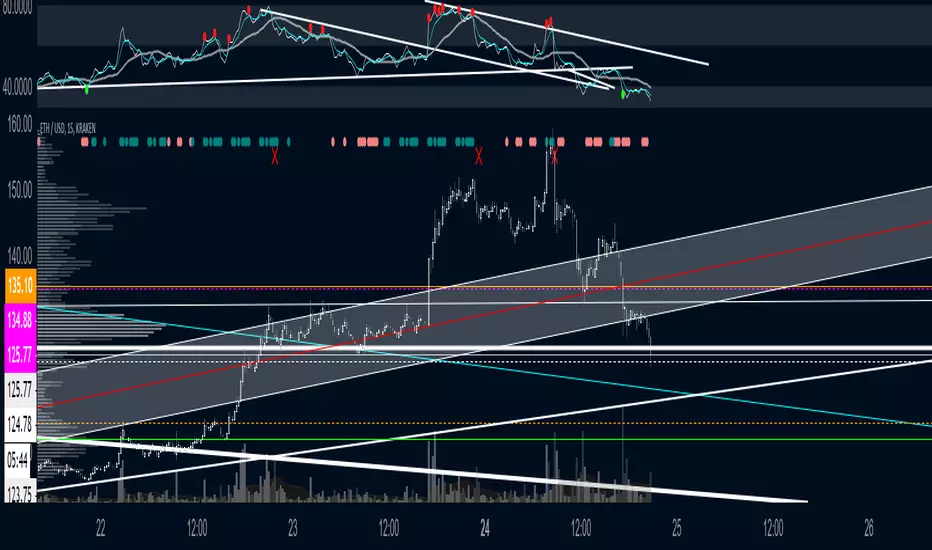
GTO is a easy to understand and use script
it just uses candle closes and other variables to gauge momentum that is then plotted on top of the chart
teal = bullish
salmon = bearish
you want them plotting while in your desired trade, if you are long and bearishness starts showing may be good toexit vise versa
Red X is BULL fatigue or can other wise be seen as bearish
Green X is the opposite
@satoshiiheavy
Technical Analyst for cryptcurrentlyvip.com
סקריפט מוגן
סקריפט זה פורסם כמקור סגור. עם זאת, תוכל להשתמש בו בחופשיות וללא כל מגבלות – למד עוד כאן
Have a plan. Trade it!
כתב ויתור
המידע והפרסומים אינם מיועדים להיות, ואינם מהווים, ייעוץ או המלצה פיננסית, השקעתית, מסחרית או מכל סוג אחר המסופקת או מאושרת על ידי TradingView. קרא עוד ב־תנאי השימוש.
סקריפט מוגן
סקריפט זה פורסם כמקור סגור. עם זאת, תוכל להשתמש בו בחופשיות וללא כל מגבלות – למד עוד כאן
Have a plan. Trade it!
כתב ויתור
המידע והפרסומים אינם מיועדים להיות, ואינם מהווים, ייעוץ או המלצה פיננסית, השקעתית, מסחרית או מכל סוג אחר המסופקת או מאושרת על ידי TradingView. קרא עוד ב־תנאי השימוש.