PROTECTED SOURCE SCRIPT
Bell Curve Levels

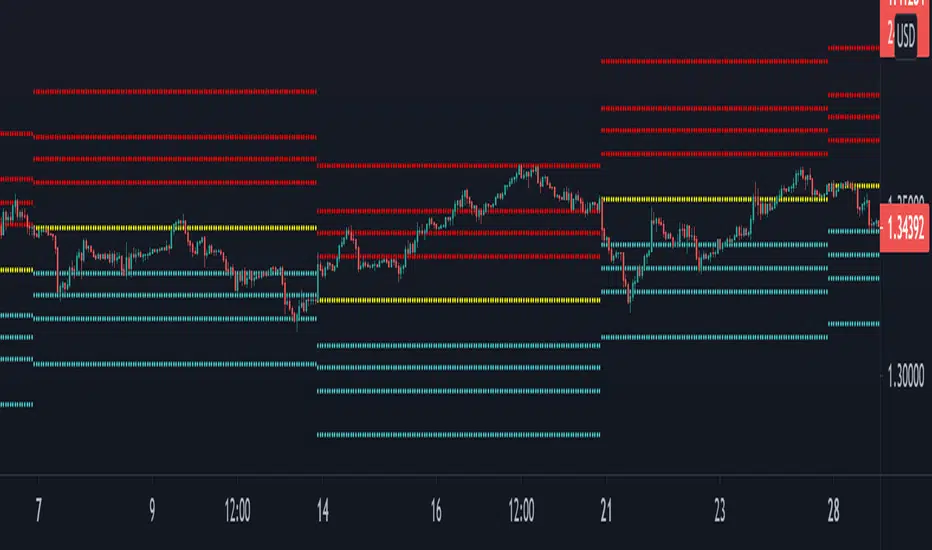
Script which plots the % change from the open and overlays the 1, 1.5, 2 & 3% levels on the chart.
The bell curve offers a quantifiable clue to the persistent percentages the price moves in the fx market. A simple histogram will convey the %change in bins
this indicator just reflects that with levels on the chart.
Can be an aide for intraday or longer term levels.
Feel free to message me with any queries.
סקריפט מוגן
סקריפט זה פורסם כמקור סגור. עם זאת, תוכל להשתמש בו בחופשיות וללא כל מגבלות – למד עוד כאן
כתב ויתור
המידע והפרסומים אינם מיועדים להיות, ואינם מהווים, ייעוץ או המלצה פיננסית, השקעתית, מסחרית או מכל סוג אחר המסופקת או מאושרת על ידי TradingView. קרא עוד ב־תנאי השימוש.
סקריפט מוגן
סקריפט זה פורסם כמקור סגור. עם זאת, תוכל להשתמש בו בחופשיות וללא כל מגבלות – למד עוד כאן
כתב ויתור
המידע והפרסומים אינם מיועדים להיות, ואינם מהווים, ייעוץ או המלצה פיננסית, השקעתית, מסחרית או מכל סוג אחר המסופקת או מאושרת על ידי TradingView. קרא עוד ב־תנאי השימוש.