OPEN-SOURCE SCRIPT
Gradiente
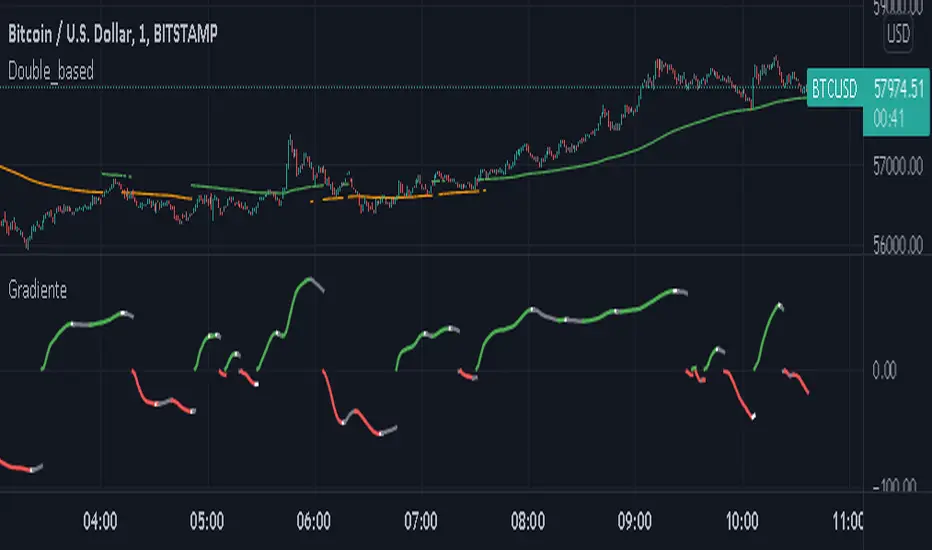
This indicator works in following concep. In a trend the area between two EMA increases as the trend go forward. When the trend loose strenth the fast EMA is the first to slow down and the area betwenn the EMA stop to increase indicating a lost of momentum.
The gradient is the division of the area formed between the EMA by the number of bars it contains.
In a up-trend is above 0.
In a down-trend is below 0.
The color green in the up trend shows the strenth is on, the white color shows the momentum is weaking.
The color red in the down trend shows the strenth is on, the white color shows the momentum is weaking.
Is necessary to plot the same EMA periods on the chart price to compare the strenth.
סקריפט קוד פתוח
ברוח האמיתית של TradingView, יוצר הסקריפט הזה הפך אותו לקוד פתוח, כך שסוחרים יוכלו לעיין בו ולאמת את פעולתו. כל הכבוד למחבר! אמנם ניתן להשתמש בו בחינם, אך זכור כי פרסום חוזר של הקוד כפוף ל־כללי הבית שלנו.
כתב ויתור
המידע והפרסומים אינם מיועדים להיות, ואינם מהווים, ייעוץ או המלצה פיננסית, השקעתית, מסחרית או מכל סוג אחר המסופקת או מאושרת על ידי TradingView. קרא עוד ב־תנאי השימוש.