OPEN-SOURCE SCRIPT
מעודכן Paranoia Indicator
The Paranoia Indicator is a technical analysis tool that combines three popular indicators: Relative Strength Index (RSI), Moving Average Convergence Divergence (MACD), and Stochastic. The Paranoia Indicator formula is calculated by taking a weighted average of the three indicators, with the weights being 23.6%, 61.8%, and 14.6%, respectively.
The Paranoia Indicator is used to identify potential trend reversals and overbought/oversold conditions in the market. When the indicator is above zero, it is considered bullish, and when it is below zero, it is considered bearish. The Paranoia Indicator also has extreme bands that help to identify when the market is overbought or oversold.
Traders can use the Paranoia Indicator in conjunction with other technical analysis tools to confirm trading signals and make more informed trading decisions. The Paranoia Indicator is suitable for all types of markets, including stocks, forex, and commodities, and can be applied to any time frame.
Overall, the Paranoia Indicator is a useful tool for traders looking to identify potential trend reversals and overbought/oversold conditions in the market.
הערות שחרור
### IS - Impulse Signal: A Composite Sentiment Oscillator**1. General Summary**
The "IS - Impulse Signal" indicator is an advanced oscillator designed to measure market sentiment and momentum in a unique way. Instead of relying on a single metric, it merges the insights from three of the most reliable technical indicators (RSI, MACD, and Stochastic) into a single sentiment line, offering a more comprehensive and robust view of price dynamics.
The goal is to filter out market noise and provide clear signals about the direction and strength of the underlying momentum.
---
**2. How It Works: The Core Formula**
The heart of the indicator is its custom calculation formula, which normalizes and weights each component:
* **MACD (61.8% weight):** A custom version is used, measuring the ratio between a fast EMA (6) and a slow EMA (60). This offers a unique perspective on trend convergence and divergence.
* **RSI (23.6% weight):** Measures the speed and strength of price movement using a 27-period setting to smooth the signal.
* **Stochastic (14.6% weight):** Provides information on the current closing price relative to its range over a long period (70), indicating potential exhaustion zones.
These three components are normalized and combined into a weighted average inspired by Fibonacci ratios to create the main **Impulse Signal** line.
---
**3. How to Interpret and Use the Indicator**
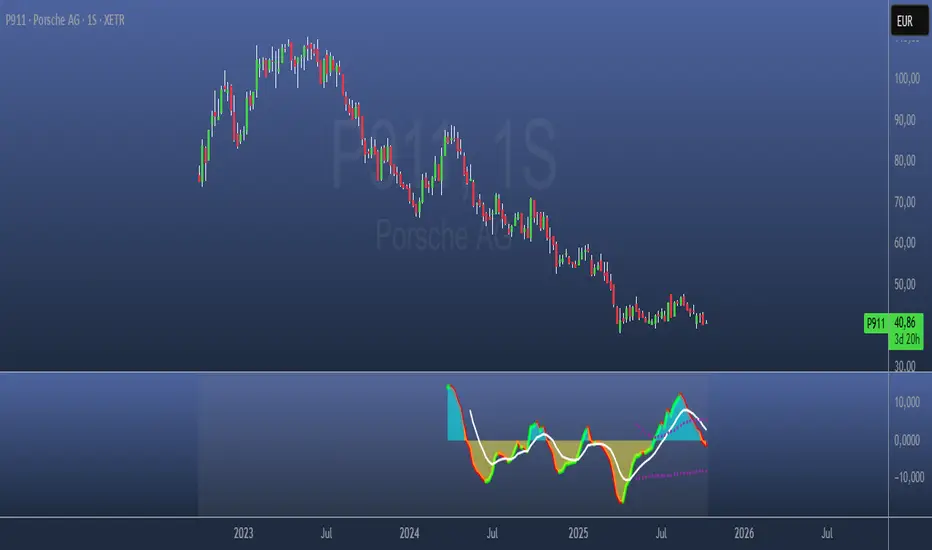
The indicator is displayed in a sub-panel with several key elements for interpretation:
* **Main Line (Impulse Signal):** This is the sentiment oscillator.
* **Above zero:** Indicates that the overall market sentiment is bullish.
* **Below zero:** Indicates that the overall market sentiment is bearish.
* **Color Change:** Green signals increasing sentiment (positive momentum), while red signals decreasing sentiment (negative momentum).
* **Filter (White Middle Line):** This is an EMA of the main line that acts as a signal line.
* **Upward Crossover:** When the main line crosses above the filter, it's a buy signal or bullish confirmation.
* **Downward Crossover:** When it crosses below, it's a sell signal or bearish confirmation.
* **Volatility Bands (Purple & Gray):** These act as a map of sentiment conditions.
* **Inner Bands (Purple):** Mark the "normal" volatility zone for sentiment. Touching or exiting these bands can indicate strong momentum.
* **Outer Bands (Gray):** Signal extreme sentiment conditions. Reaching these zones may warn of a potential price overextension and an imminent reversal.
---
**4. Visual Guide & Signals on YouTube**
For a much deeper understanding and practical examples of how to find high-probability signals with this indicator, I have created a series of videos on my YouTube channel. I invite you to watch them!
I hope this tool proves very useful for improving your analysis and trading. All comments and suggestions are welcome!
סקריפט קוד פתוח
ברוח האמיתית של TradingView, יוצר הסקריפט הזה הפך אותו לקוד פתוח, כך שסוחרים יוכלו לעיין בו ולאמת את פעולתו. כל הכבוד למחבר! אמנם ניתן להשתמש בו בחינם, אך זכור כי פרסום חוזר של הקוד כפוף ל־כללי הבית שלנו.
כתב ויתור
המידע והפרסומים אינם מיועדים להיות, ואינם מהווים, ייעוץ או המלצה פיננסית, השקעתית, מסחרית או מכל סוג אחר המסופקת או מאושרת על ידי TradingView. קרא עוד ב־תנאי השימוש.