OPEN-SOURCE SCRIPT
מעודכן Oscillating Market Case Study
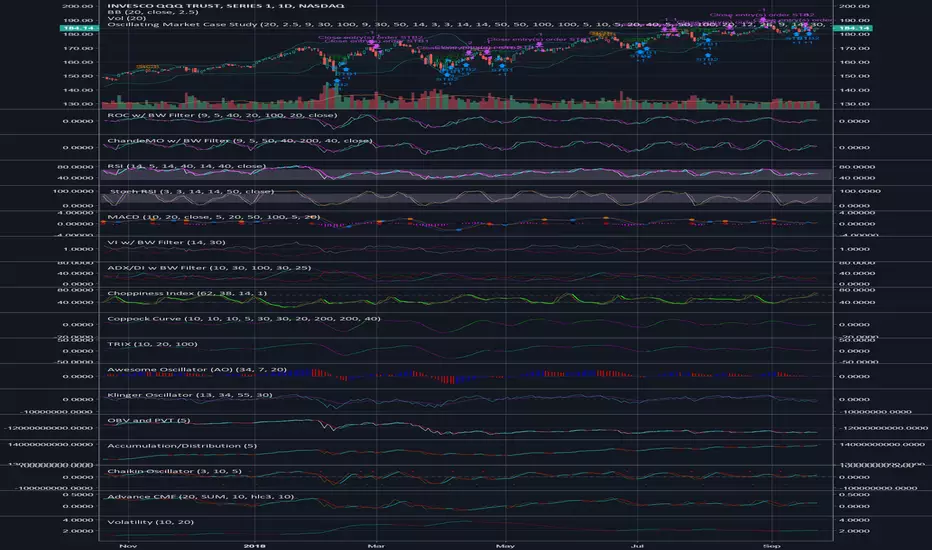
This is a little something I created to analyze the market. Ultimately, I wanted to create something that could encapsulate the entire market as best as possible. The idea was simple, use technical analysis to create cases that would indicate entry positions and exit positions for long positions initially. After completing that, I decided to add a few shorting cases.
A combination of 25-30 indicators were used to create this, and the indicators were modified with a filter to create a smoothed overlay.
So here's the breakdown:
- 10 total cases: 7 long, 3 short
- The 7 long cases are broken down into three categories; long term, medium term, short term
- Short Term: OC1, OC2, STB1, STB2
- Medium Term: STB1, STB2
- Long Term: LTB1
- Shorting Cases: SC1, SC2, SC3
- The cases are both plotted as text and entry orders; this can be toggled on and off through the format menu.
I suggest you use the format menu to get the most out of this script. The menu consists of toggles to turn of the plots and/or the entries. It's pretty self explanatory. Use it to keep the chart cleared and concise so you only visualise the cases that you need.
Personally, the cases that have worked the best for me are:
- Long Cases: OC1, OC2, STB2, LTB1
- Shorting Cases: SC2, SC3
I kept this description as short as possible, but please feel free to reach out if you have any questions.
Pretty much, use the cases and see if it works for you.
הערות שחרור
Wanted to post a clearer picture without all the indicators. Work with the toggles in the format menu, it will let you filter which cases you see and allow you to decide the best combinations. Wish I could post images with a tutorial. Let me know if you have any questions. This is a little something I created to analyze the market. Ultimately, I wanted to create something that could encapsulate the entire market as best as possible. The idea was simple, use technical analysis to create cases that would indicate entry positions and exit positions for long positions initially. After completing that, I decided to add a few shorting cases.
A combination of 25-30 indicators were used to create this, and the indicators were modified with a filter to create a smoothed overlay.
So here's the breakdown:
- 10 total cases: 7 long, 3 short
- The 7 long cases are broken down into three categories; long term, medium term, short term
- Short Term: OC1, OC2, STB1, STB2
- Medium Term: STB1, STB2
- Long Term: LTB1
- Shorting Cases: SC1, SC2, SC3
- The cases are both plotted as text and entry orders; this can be toggled on and off through the format menu.
I suggest you use the format menu to get the most out of this script. The menu consists of toggles to turn of the plots and/or the entries. It's pretty self explanatory. Use it to keep the chart cleared and concise so you only visualise the cases that you need.
Personally, the cases that have worked the best for me are:
- Long Cases: OC1, OC2, STB2, LTB1
- Shorting Cases: SC2, SC3
I kept this description as short as possible, but please feel free to reach out if you have any questions.
Pretty much, use the cases and see if it works for you.
סקריפט קוד פתוח
ברוח האמיתית של TradingView, יוצר הסקריפט הזה הפך אותו לקוד פתוח, כך שסוחרים יוכלו לעיין בו ולאמת את פעולתו. כל הכבוד למחבר! אמנם ניתן להשתמש בו בחינם, אך זכור כי פרסום חוזר של הקוד כפוף ל־כללי הבית שלנו.
כתב ויתור
המידע והפרסומים אינם מיועדים להיות, ואינם מהווים, ייעוץ או המלצה פיננסית, השקעתית, מסחרית או מכל סוג אחר המסופקת או מאושרת על ידי TradingView. קרא עוד ב־תנאי השימוש.