OPEN-SOURCE SCRIPT
מעודכן 3 Weeks Tight - CANSLIM Technical Indicator

3 Weeks Tight - Introduction
3 weeks tight is a bullish continuation pattern discovered by IBD's founder, William O'Neil.
The pattern can used as an opportunity to add to an existing position as it often occurs after a breakout above a cup with handle or other technical pattern.
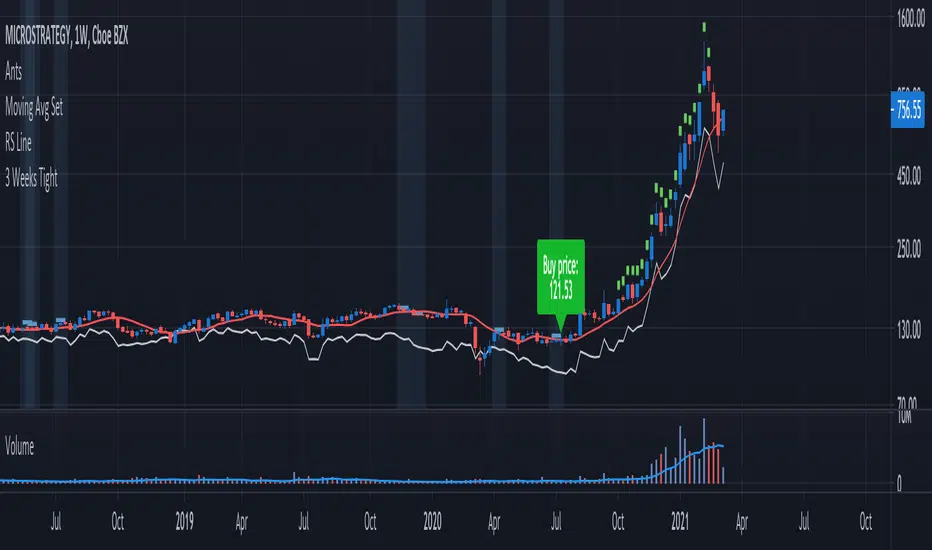
The 3 weeks tight pattern forms when a stock closes within approximately 1% to 1.5% of the prior week's close for at least two weeks. The reason for the bullishness is that it indciates that investors who moved the stock upward in price since the breakout are not taking profits, the price is holding steady.
The buy point is just above the area of resistance formed at the highs of the three weeks plus 10 cents. The ten cent addition to the price is to ensure a push through the resistance at the high of the range.

Key Points:
Features:
3 weeks tight is a bullish continuation pattern discovered by IBD's founder, William O'Neil.
The pattern can used as an opportunity to add to an existing position as it often occurs after a breakout above a cup with handle or other technical pattern.
The 3 weeks tight pattern forms when a stock closes within approximately 1% to 1.5% of the prior week's close for at least two weeks. The reason for the bullishness is that it indciates that investors who moved the stock upward in price since the breakout are not taking profits, the price is holding steady.
The buy point is just above the area of resistance formed at the highs of the three weeks plus 10 cents. The ten cent addition to the price is to ensure a push through the resistance at the high of the range.
Key Points:
- It's preferred that closes for each week are in the upper half of the stock's range.
- Ideally, volume will increase significantly as the stocks moves past the buy point.
- This pattern generally performs best when the market is in an uptrend.
Features:
- A configurable horizontal bar that spans the 3 week period.
- A vertical band that highlights the tightness pattern.
- A label to show the buy price after 3 week tight pattern.
- Optional alert when the 3 weeks tight pattern is recognized.
הערות שחרור
version 2.0Updates:
■ The offset of the "Buy price" can be moved up/down.
■ The font size of the "Buy price" can be configured.
הערות שחרור
version 3.0Updates:
■ Percent change calculations have been updated.
■ Settings dialog now groups together similar features.
סקריפט קוד פתוח
ברוח TradingView אמיתית, היוצר של הסקריפט הזה הפך אותו לקוד פתוח, כך שסוחרים יכולים לבדוק ולאמת את הפונקציונליות שלו. כל הכבוד למחבר! למרות שאתה יכול להשתמש בו בחינם, זכור שפרסום מחדש של הקוד כפוף לכללי הבית שלנו.
Access our premium tools: LevelUpTools.net
Join traders in over 40 countries and LevelUp!
Join traders in over 40 countries and LevelUp!
כתב ויתור
המידע והפרסומים אינם אמורים להיות, ואינם מהווים, עצות פיננסיות, השקעות, מסחר או סוגים אחרים של עצות או המלצות שסופקו או מאושרים על ידי TradingView. קרא עוד בתנאים וההגבלות.