OPEN-SOURCE SCRIPT
Modified Box Plots

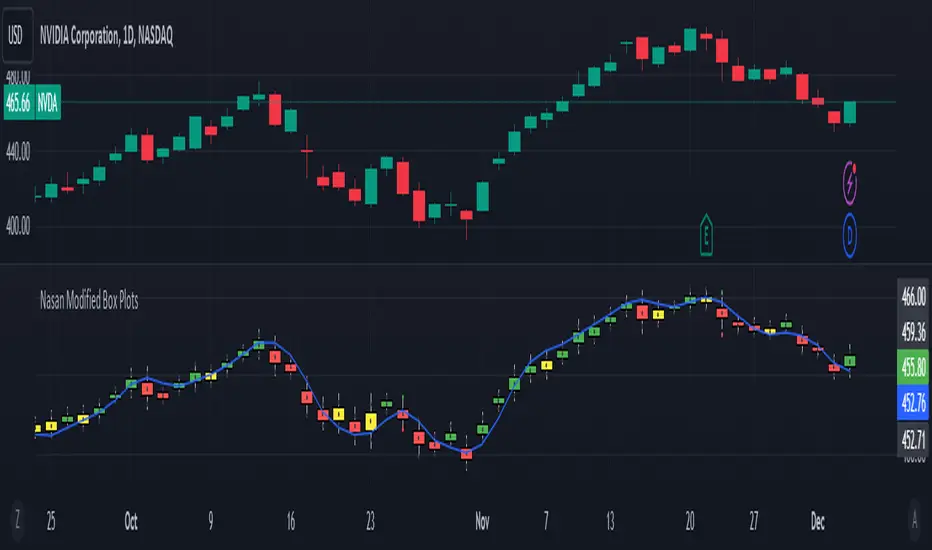
Box Plot Concept: The script creates a modified box plot where the central box represents the range within 1 standard deviation from the midpoint (hl2), which is the average of the high and low prices. The whiskers extend to cover a range of 3 standard deviations, providing a visualization of the overall price distribution.
Color Scheme: The color of the modified box plot is determined based on comparisons between the current midpoint (g) and the +/- 1 SD values of the previous candle (i[1] and j[1]). If g > i[1], the color is green; if g < j[1], it's red; otherwise, it's yellow. This color scheme allows users to quickly assess the relationship between the current market conditions and recent price movements. if the mid point price is above/below +/- 1 SD values of the previous candle the price movement is considered as significant.
Plotcandle Function: The plotcandle function is employed to visualize the modified box plot. The color of the box is dynamically determined by the candleColor variable, which reflects the current market state based on the color scheme. The wicks, represented by lines extending from the box, are colored in white.
Explanation of Box and Wicks:
Box (Open and Close): In this modified box plot, the box does not represent traditional open and close prices. Instead, it signifies a range within 1 standard deviation of the midpoint (hl2), providing insight into the typical price variation around the average of the high and low.
Wicks (High and Low): The wicks extend from the box to cover a range of 3 standard deviations from the midpoint (hl2). They do not correspond to the actual high and low prices but serve as a visualization of potential outliers in the price distribution. The actual high and low prices are also plotted as green and red dots when the actual high and low prices fall outside the +/- 3SD wicks (whiskers) and also indicate the prices does not fit the distribution based on the recent price volatility.
In summary, this modified box plot offers a unique perspective on price distribution by considering standard deviations from the midpoint. The color scheme aids in quickly assessing market conditions, and the wicks provide insights into the potential presence of outliers. It's essential to understand that the box and wicks do not represent traditional open, close, high, and low prices but offer a different way to visualize and interpret intraday price movements.
Step by step explanation
Here's the step-by-step explanation:
a = ta.highest(high, 7): Calculates the highest high in the last 7 bars.
b = ta.lowest(low, 7): Calculates the lowest low in the last 7 bars.
c = ta.stdev(hl2, 7): Calculates the standard deviation of the average of high and low prices (hl2) over the last 7 bars.
d = (a - b) / c: Computes a scaling factor d based on the highest, lowest, and standard deviation. This factor is used to scale the intraday range in the next steps.
e = (high - low): Calculates the intraday range of the candle.
f = e / d: Estimates the standard deviation (f) of the intraday candle price using the scaling factor d.
g = hl2: Defines the intraday midpoint of the candle, which is the average of high and low prices.
i = g + 1 * f, j = g - 1 * f, k = g + 3 * f, l = g - 3 * f: Calculate values representing coverage of +1 SD, -1 SD, +3 SD, and -3 SD from the intraday midpoint.
The script utilizes historical high, low, and standard deviation values to dynamically estimate the standard deviation of the intraday candle, providing a measure of volatility for the current price range. This estimation is then used to construct a modified box plot around the intraday midpoint.
In addition I have included a 7 period hull moving average just to see the overall trend direction.
Conclusion:
The "Nasan Modified Box Plots" indicator on TradingView is a dynamic visualization tool that provides insights into the distribution of price ranges over a specified period. It adapts to changing market conditions by incorporating historical data in the calculation of a scaling factor (d). The indicator constructs a modified box plot, where the size of the box and the whiskers is determined by recent volatility
סקריפט קוד פתוח
ברוח האמיתית של TradingView, יוצר הסקריפט הזה הפך אותו לקוד פתוח, כך שסוחרים יוכלו לעיין בו ולאמת את פעולתו. כל הכבוד למחבר! אמנם ניתן להשתמש בו בחינם, אך זכור כי פרסום חוזר של הקוד כפוף ל־כללי הבית שלנו.
כתב ויתור
המידע והפרסומים אינם מיועדים להיות, ואינם מהווים, ייעוץ או המלצה פיננסית, השקעתית, מסחרית או מכל סוג אחר המסופקת או מאושרת על ידי TradingView. קרא עוד ב־תנאי השימוש.