CRT [TakingProphets]
**Important:** This is **not financial advice** and **does not generate buy/sell signals**. It is an **informational overlay** with **alerts** to streamline ICT-style analysis. Use it to organize context, not to automate trading decisions.
---
Overview
**CRT (Candle Range Theory)** is an ICT-inspired tool that lets you:
- **Project higher-timeframe (HTF) candles** (1m → 1M) onto any lower-timeframe chart.
- **Detect Candle Range Theory (CRT) transitions** in real time (bullish/bearish).
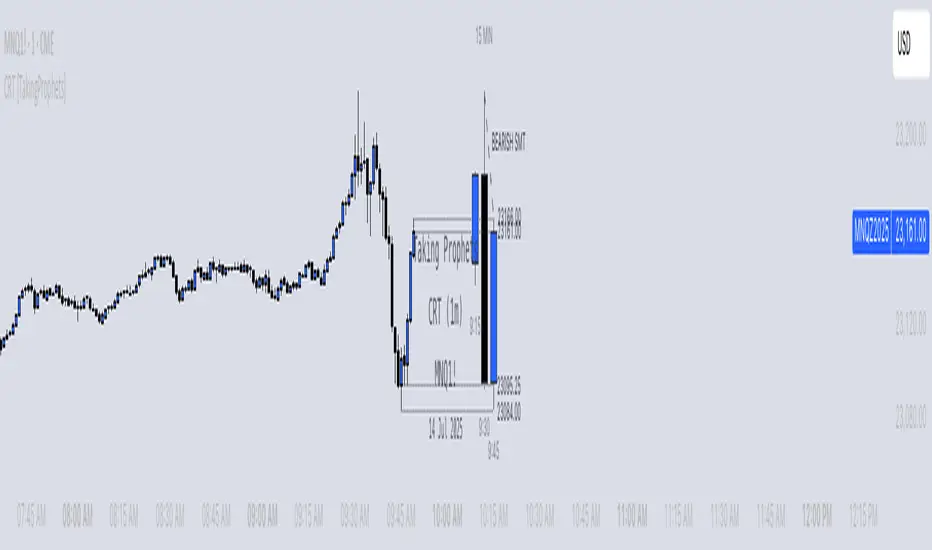
- **Identify SMT (Smart Money) divergences** against a correlated instrument (e.g., NQ↔ES).
- **Project the live Open/High/Low/Close** of the current HTF candle as intrabar reference levels.
It consolidates HTF bias, CRT structure, and SMT divergence into a single, configurable overlay—useful mainly for **alerts** and **workflow prompts**.
---
Concepts (What It Is Looking For)
Candle Range Theory (CRT)
A 3-candle, higher-timeframe pattern suggesting a failed continuation:
- **Bearish CRT:** Candle 2 attempts higher but fails—**higher high, lower close** inside Candle 1’s range.
- **Bullish CRT:** Candle 2 attempts lower but fails—**lower low, higher close** inside Candle 1’s range.
**Operational definitions used in the script (HTF candles):**
- **Bearish CRT:**
`htf_h1 > htf_h2` (Candle 2 pushes above Candle 1 high) **AND**
`htf_c1 < htf_h2` (Candle 2 closes back inside Candle 1 range) **AND**
`htf_l1 > htf_l2` (Candle 2 does not break below Candle 1 low)
- **Bullish CRT:**
`htf_l1 < htf_l2` (Candle 2 pushes below Candle 1 low) **AND**
`htf_c1 > htf_l2` (Candle 2 closes back inside Candle 1 range) **AND**
`htf_h1 < htf_h2` (Candle 2 does not break above Candle 1 high)
*(Subscripts 0/1/2 refer to current / previous / two-bars-ago HTF candles.)*
SMT (Smart Money) Divergence
Compares your chart’s HTF swing progression to a **correlated** symbol (default `CME_MINI:ES1!`):
- **Bearish SMT:** One makes a **higher high** while the other **doesn’t** (or makes a lower high).
- **Bullish SMT:** One makes a **lower low** while the other **doesn’t** (or makes a higher low).
**Definitions used:**
- **Historical SMT (between HTF[2] and HTF[1]):**
Bearish: `(htf_h1 > htf_h2) != (corr_htf_h1 > corr_htf_h2)`
Bullish: `(htf_l1 < htf_l2) != (corr_htf_l1 < corr_htf_l2)`
- **Real-time SMT (between HTF[1] and HTF[0]):**
Bearish: `(htf_h0 > htf_h1) != (corr_htf_h0 > corr_htf_h1)`
Bullish: `(htf_l0 < htf_l1) != (corr_htf_l0 < corr_htf_l1)`
---
How It Works (How It Does It)
1) HTF Candle Projection Engine
- Uses `request.security()` to fetch **HTF OHLC/time** for the last **three** HTF candles.
- Renders each HTF candle as a **body box** + **upper/lower wicks**, **offset** to the right for clarity.
- **Time labels** auto-format: `HH:MM` for intraday, `MM/DD` for D/W/M.
- **Style controls:** width, transparency, colors, borders, wick color, label size.
2) CRT Detection & Labeling
- Evaluates the above 3-bar **HTF CRT conditions** each bar.
- If met, prints a **“BULLISH CRT”** or **“BEARISH CRT”** label centered under/over the HTF stack with your chosen color/size.
3) SMT Detection (Historical & Real-Time)
- Pulls the **correlated instrument’s** HTF highs/lows (same HTF).
- **Historical SMT**: evaluates HTF[2] → HTF[1] progression and draws a diagonal labeled line **between those two candles**:
- “**BEARISH SMT**” across highs, or “**BULLISH SMT**” across lows.
- **Real-time SMT**: evaluates HTF[1] → HTF[0] as the current HTF candle is **forming**, draws a labeled line across the latest pair.
- Optional **labels** (“BULLISH/BEARISH SMT”) positioned just beyond the line for visual clarity.
4) Live OHLC Projections (Current HTF Candle)
- Projects the current HTF **Open/High/Low/Close** as **horizontal lines** into the right-hand future.
- **Start anchors:**
- **Open:** first bar of the current HTF period.
- **High / Low:** earliest bar where **current HTF high/low** first printed.
- **Close:** current bar.
- Each level can show a **price label**; **style/width** are user-configurable.
---
Inputs & Customization (How To Use It)
Timeframe Settings
- **Timeframe (HTF):** pick any from **1m → 1M**. The script will fetch that HTF and draw its last **3 candles**.
Display Settings
- **Horizontal Offset:** space to the right of live bars for the HTF stack.
- **Candle Width / Transparency / Borders / Wicks / Label Size**.
- **Time Label On/Off** and **12h/24h** clock.
Visual Settings
- **Bullish/Bearish Colors**, **Border/Wick Colors**.
SMT Settings
- **Enable SMT**, **Correlated Symbol**, **Line Style/Width/Color**, **Show Labels**.
- **Enable SMT Alerts** for both historical and **real-time** divergence.
Projection Settings
- **Enable Projections**, **Left Extension (bars)**, **Line Style/Width**, **Show Price Labels**, per-level colors (**Open/High/Low/Close**).
---
Alerts (Primary Utility)
> **Intended use:** alerts as **workflow prompts**. They highlight context changes (CRT/SMT) you may want to inspect—**not** entries or signals.
Built-in alertconditions:
- **Bullish CRT / Bearish CRT** — detected on your chosen HTF.
- **Bullish SMT / Bearish SMT** — historical (HTF[2]→HTF[1]).
- **Bullish Real-time SMT / Bearish Real-time SMT** — forming (HTF[1]→HTF[0]).
**Suggested alert messages** (examples):
- “CRT: **Bullish CRT** confirmed on {{ticker}} / {{timeframe}}”
- “CRT: **Bearish SMT** (historical) detected on {{ticker}} / {{timeframe}}”
- “CRT: **Bullish SMT** (real-time) forming on {{ticker}} / {{timeframe}}”
---
Practical Workflow
1. **Pick your HTF** (e.g., 4H on a 5m execution chart).
2. **Enable CRT & SMT alerts.**
3. When an alert fires:
- **CRT** → potential **failed continuation** on HTF (bias context).
- **SMT** → **intermarket divergence** confirming/invalidating CRT context.
4. **Use live HTF OHLC lines** for bias/levels (support/resistance/targets).
5. Make decisions within your **own model & risk plan**. This overlay is **context only**.
---
Originality & Closed-Source Justification
- Integrated **multi-module HTF engine** (3-bar rendering with precise time/offset),
- **Formal CRT test** implemented on **fetched HTF candles** (not LTF approximations),
- Dual-mode **SMT (historical + real-time)** with drawn, labeled lines tied to exact HTF pairs,
- **Deterministic OHLC projection** logic (first/earliest occurrence anchoring for O/H/L + current close),
- A cohesive **alert framework** centered on CRT + SMT + projections for **workflow discipline**—no signals or automation.
---
Notes & Limitations
- HTF values are **intrabar** until the HTF candle closes; labels/lines can update as new data arrives.
- Divergence depends on your **correlated symbol** choice (relationships differ by market/regime).
- Weekends/illiquid sessions can distort extremes and time labels.
- **Educational tool only.** Not investment advice. No performance claims. Always combine with your narrative/risk management.
---
**License/Attribution:** ICT-inspired concepts (Candle Range Theory, intermarket SMT). Implementation and alert framework by **TakingProphets**.
סקריפט להזמנה בלבד
רק משתמשים שאושרו על ידי המחבר יכולים לגשת לסקריפט הזה. תצטרך לבקש ולקבל אישור להשתמש בו. אישור זה ניתן בדרך כלל לאחר תשלום. לפרטים נוספים, בצע את ההוראות של המחבר למטה או צור קשר ישירות עם TakingProphets.
TradingView לא ממליצה לשלם עבור סקריפט או להשתמש בו, אלא אם כן אתה סומך לחלוטין על המחבר שלו ומבין איך הוא עובד. ייתכן שתמצא גם אלטרנטיבות חינמיות בקוד פתוח בסקריפטים של הקהילה שלנו.
הוראות המחבר
כתב ויתור
סקריפט להזמנה בלבד
רק משתמשים שאושרו על ידי המחבר יכולים לגשת לסקריפט הזה. תצטרך לבקש ולקבל אישור להשתמש בו. אישור זה ניתן בדרך כלל לאחר תשלום. לפרטים נוספים, בצע את ההוראות של המחבר למטה או צור קשר ישירות עם TakingProphets.
TradingView לא ממליצה לשלם עבור סקריפט או להשתמש בו, אלא אם כן אתה סומך לחלוטין על המחבר שלו ומבין איך הוא עובד. ייתכן שתמצא גם אלטרנטיבות חינמיות בקוד פתוח בסקריפטים של הקהילה שלנו.