מעודכן
Seasonal Tendency° [Pro+] by toodegrees
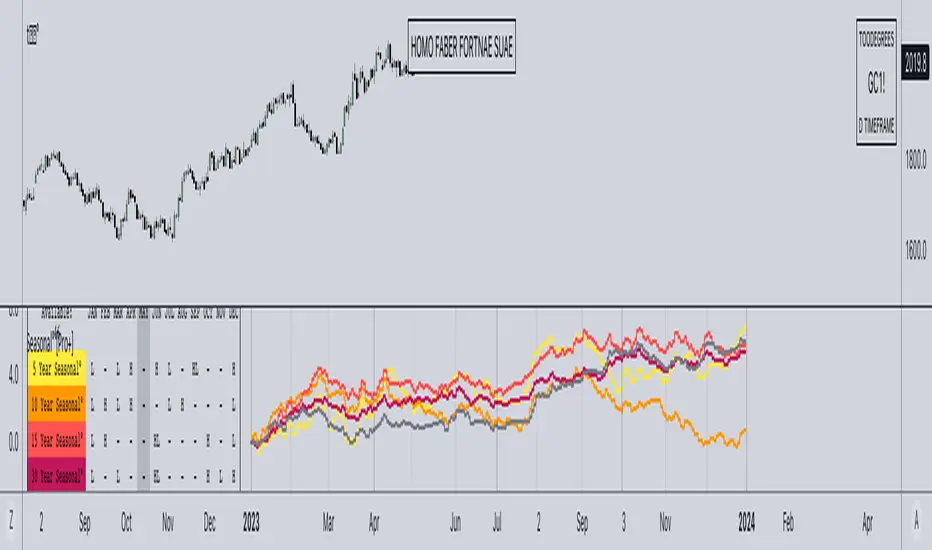
TRADINGVIEW IMAGE IS NOT DISPLAYING THE TOOL CORRECTLY, CHECK OUT THE IMAGES BELOW!
Description:
A Seasonal Tendency is a historical pattern or roadmap that reflects how price action has behaved in the past during specific time periods, usually on a monthly basis. It is not an absolute guarantee of future price movements, but rather a general rule of thumb to identify potential high-probability long-term trades. Seasonal tendencies can be used to analyze various pairs and asset classes, and when combined with the underlying market trends or conditions, they can help traders narrow down specific times of the year when big moves are more likely to occur.
Keep in mind that while these seasonal tendencies have been successfully compared with the Inner Circle Trader's go-to seasonal third-party provider and are based on sound statistical logic, their reliability is dependent on the data available on TradingView. This means that the accuracy and relevance of these tendencies may vary, but they still serve as valuable tools for identifying potential high-probability trading opportunities when used in conjunction with other market analysis techniques. Pay attention to the Years of Data used to determine the significance of the information for your trading hypotheses.
Tool Features:
Discover the power of our innovative tool that seamlessly integrates all available TradingView data to create a dynamic on-chart seasonal display:
– Monitor the 5, 10, 15, 30, and All Time Seasonal graphs with ease
– Effortlessly visualize and align the seasonal graphs with real-time prices for a holistic view
– Align the seasonal graph with the annual timeline, pinpointing precise moments for potential trading setups, keeping Months and Quarters in mind
– Read into the seasonality thanks to the Seasonal Lows and Highs Matrix
– Auto-detect the underlying Futures Contract's Asset Class
– Monitor the entire Asset Class' Seasonal Tendencies with a tailored Seasonal Lows and Highs Matrix
Find a Video Preview and the User Manual here.
Templates:
Dark Mode

Table+Overlay

Holy Seasonal
Collection of all Asset Classes for Commodity Futures in one place. Note: the number of dashboards depends on your Tradingview Plan.
To Get Access, and Level Up see the Author's Instructions below!
This indicator is available only on the TradingView platform.
⚠️ Intellectual Property Rights ⚠️
While this tool's base concepts are public, its interpretation, code, and presentation are protected intellectual property. Unauthorized copying or distribution is prohibited.
⚠️ Terms and Conditions ⚠️
This financial tool is for educational purposes only and not financial advice. Users assume responsibility for decisions made based on the tool's information. Past performance doesn't guarantee future results. By using this tool, users agree to these terms.
Description:
A Seasonal Tendency is a historical pattern or roadmap that reflects how price action has behaved in the past during specific time periods, usually on a monthly basis. It is not an absolute guarantee of future price movements, but rather a general rule of thumb to identify potential high-probability long-term trades. Seasonal tendencies can be used to analyze various pairs and asset classes, and when combined with the underlying market trends or conditions, they can help traders narrow down specific times of the year when big moves are more likely to occur.
Keep in mind that while these seasonal tendencies have been successfully compared with the Inner Circle Trader's go-to seasonal third-party provider and are based on sound statistical logic, their reliability is dependent on the data available on TradingView. This means that the accuracy and relevance of these tendencies may vary, but they still serve as valuable tools for identifying potential high-probability trading opportunities when used in conjunction with other market analysis techniques. Pay attention to the Years of Data used to determine the significance of the information for your trading hypotheses.
Tool Features:
Discover the power of our innovative tool that seamlessly integrates all available TradingView data to create a dynamic on-chart seasonal display:
– Monitor the 5, 10, 15, 30, and All Time Seasonal graphs with ease
– Effortlessly visualize and align the seasonal graphs with real-time prices for a holistic view
– Align the seasonal graph with the annual timeline, pinpointing precise moments for potential trading setups, keeping Months and Quarters in mind
– Read into the seasonality thanks to the Seasonal Lows and Highs Matrix
– Auto-detect the underlying Futures Contract's Asset Class
– Monitor the entire Asset Class' Seasonal Tendencies with a tailored Seasonal Lows and Highs Matrix
Find a Video Preview and the User Manual here.
Templates:
Dark Mode
Table+Overlay
Holy Seasonal
Collection of all Asset Classes for Commodity Futures in one place. Note: the number of dashboards depends on your Tradingview Plan.
To Get Access, and Level Up see the Author's Instructions below!
This indicator is available only on the TradingView platform.
⚠️ Intellectual Property Rights ⚠️
While this tool's base concepts are public, its interpretation, code, and presentation are protected intellectual property. Unauthorized copying or distribution is prohibited.
⚠️ Terms and Conditions ⚠️
This financial tool is for educational purposes only and not financial advice. Users assume responsibility for decisions made based on the tool's information. Past performance doesn't guarantee future results. By using this tool, users agree to these terms.
הערות שחרור
Minor Changesהערות שחרור
2025 Setting Overrideזמין במרחב בתשלום
אינדיקטור זה זמין רק למנויי Toodegrees Elite Collection. הצטרף כדי לגשת לסקריפט זה ולסקריפטים אחרים מאת toodegrees.
homo faber fortunæ suæ
כתב ויתור
המידע והפרסומים אינם מיועדים להיות, ואינם מהווים, ייעוץ או המלצה פיננסית, השקעתית, מסחרית או מכל סוג אחר המסופקת או מאושרת על ידי TradingView. קרא עוד ב־תנאי השימוש.
זמין במרחב בתשלום
אינדיקטור זה זמין רק למנויי Toodegrees Elite Collection. הצטרף כדי לגשת לסקריפט זה ולסקריפטים אחרים מאת toodegrees.
homo faber fortunæ suæ
כתב ויתור
המידע והפרסומים אינם מיועדים להיות, ואינם מהווים, ייעוץ או המלצה פיננסית, השקעתית, מסחרית או מכל סוג אחר המסופקת או מאושרת על ידי TradingView. קרא עוד ב־תנאי השימוש.