OPEN-SOURCE SCRIPT
מעודכן Volume Candlestick Heatmap Colors [vnhilton]

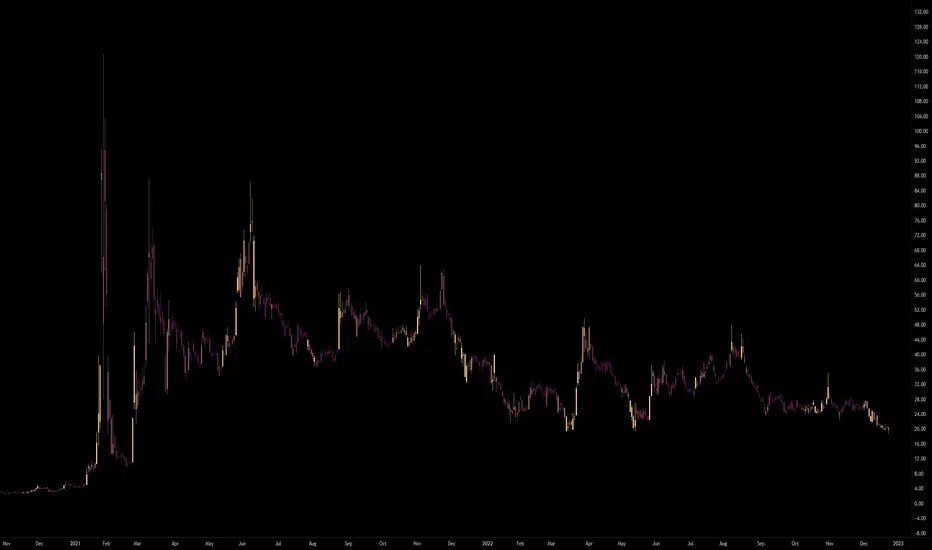
This indicator colours candles based on their volume for a set period of time. The highest volume & lowest volume in this period are set by 2 colours, & any candle with volume inside the range will have a colour based on the gradient created by the 2 colours. Ability to hide the candle body, wick, border if preferred (Hide candlestick body, wick, border, through the settings if applicable). Features 20 pre-set themes + ability to set your own custom theme.

Anamnisar; Aubergine; Between The Clouds; Bichrome

Bora Bora; Candy; Cherryblossoms; Dracula

Dance To Forget; Fresh Turboscent; Friday; Frozen

Miaka; Minnesota Vikings; Misty Meadow; Monochrome

Neon Life; Purple Bliss; Purple Paradise; Sea Blizz

Shore; Sky; Starfall; Superman

Talking To Mice Elf; The Strain; Winter; Vasily
Anamnisar; Aubergine; Between The Clouds; Bichrome
Bora Bora; Candy; Cherryblossoms; Dracula
Dance To Forget; Fresh Turboscent; Friday; Frozen
Miaka; Minnesota Vikings; Misty Meadow; Monochrome
Neon Life; Purple Bliss; Purple Paradise; Sea Blizz
Shore; Sky; Starfall; Superman
Talking To Mice Elf; The Strain; Winter; Vasily
הערות שחרור
CORRECTION: 28* themes not 20.סקריפט קוד פתוח
ברוח האמיתית של TradingView, יוצר הסקריפט הזה הפך אותו לקוד פתוח, כך שסוחרים יוכלו לעיין בו ולאמת את פעולתו. כל הכבוד למחבר! אמנם ניתן להשתמש בו בחינם, אך זכור כי פרסום חוזר של הקוד כפוף ל־כללי הבית שלנו.
כתב ויתור
המידע והפרסומים אינם מיועדים להיות, ואינם מהווים, ייעוץ או המלצה פיננסית, השקעתית, מסחרית או מכל סוג אחר המסופקת או מאושרת על ידי TradingView. קרא עוד ב־תנאי השימוש.
סקריפט קוד פתוח
ברוח האמיתית של TradingView, יוצר הסקריפט הזה הפך אותו לקוד פתוח, כך שסוחרים יוכלו לעיין בו ולאמת את פעולתו. כל הכבוד למחבר! אמנם ניתן להשתמש בו בחינם, אך זכור כי פרסום חוזר של הקוד כפוף ל־כללי הבית שלנו.
כתב ויתור
המידע והפרסומים אינם מיועדים להיות, ואינם מהווים, ייעוץ או המלצה פיננסית, השקעתית, מסחרית או מכל סוג אחר המסופקת או מאושרת על ידי TradingView. קרא עוד ב־תנאי השימוש.