OPEN-SOURCE SCRIPT
מעודכן MACD Dashboard

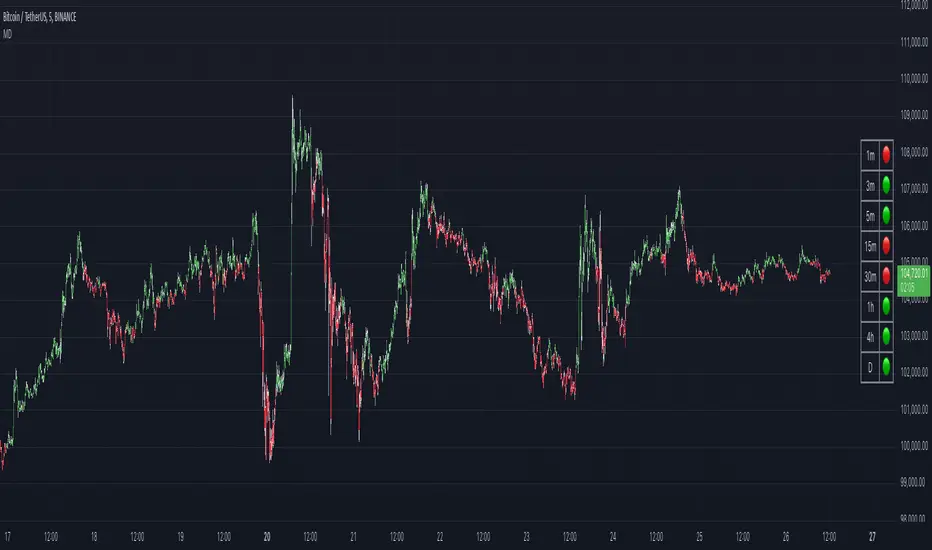
The MACD Dashboard is an addition to my collection of various dashboards that are designed to help traders make wiser decisions.
How to Use MACD Dashboard:
How to Use MACD Dashboard:
- Timeframe Selection: Based on your trading style and preferences, choose the relevant timeframes. In the settings, enable or disable timeframes to focus on the most relevant ones for your strategy.
- Dashboard Interpretation: The MACD Dashboard displays green (🟢) and red (🔴) symbols to indicate when the MACD is in green or in the red zone. You can also leverage the MACD values on the dashboard to better interpret sentiment and its changes.
- Confirmation and Strategy: Consider MACD Dashboard signals as confirmation for your trading strategy. For instance, in an uptrend, look for long opportunities when the dashboard displays consistent green symbols. Conversely, in a downtrend, focus on short opportunities when red symbols dominate.
- Risk Management: As with any indicator, use the MACD Dashboard in conjunction with proper risk management techniques. Avoid trading solely based on indicator signals; instead, integrate them into a comprehensive trading plan.
הערות שחרור
🏎️ Improved performance: Optimized the indicator’s calculations for faster loading and smoother experience.🐛 Bug fix: Resolved an issue where the indicator did not display on instruments that don’t support intraday timeframes.
הערות שחרור
🛠️ Revert the change related to intraday timeframes. Turned out it's a limitation of TradingView that cannot be bypassed, and my workaround broke the intraday on some other funds, such as leveraged assets.סקריפט קוד פתוח
ברוח האמיתית של TradingView, יוצר הסקריפט הזה הפך אותו לקוד פתוח, כך שסוחרים יוכלו לעיין בו ולאמת את פעולתו. כל הכבוד למחבר! אמנם ניתן להשתמש בו בחינם, אך זכור כי פרסום חוזר של הקוד כפוף ל־כללי הבית שלנו.
כתב ויתור
המידע והפרסומים אינם מיועדים להיות, ואינם מהווים, ייעוץ או המלצה פיננסית, השקעתית, מסחרית או מכל סוג אחר המסופקת או מאושרת על ידי TradingView. קרא עוד ב־תנאי השימוש.
סקריפט קוד פתוח
ברוח האמיתית של TradingView, יוצר הסקריפט הזה הפך אותו לקוד פתוח, כך שסוחרים יוכלו לעיין בו ולאמת את פעולתו. כל הכבוד למחבר! אמנם ניתן להשתמש בו בחינם, אך זכור כי פרסום חוזר של הקוד כפוף ל־כללי הבית שלנו.
כתב ויתור
המידע והפרסומים אינם מיועדים להיות, ואינם מהווים, ייעוץ או המלצה פיננסית, השקעתית, מסחרית או מכל סוג אחר המסופקת או מאושרת על ידי TradingView. קרא עוד ב־תנאי השימוש.