OPEN-SOURCE SCRIPT
Volume Buy/Sell Chart
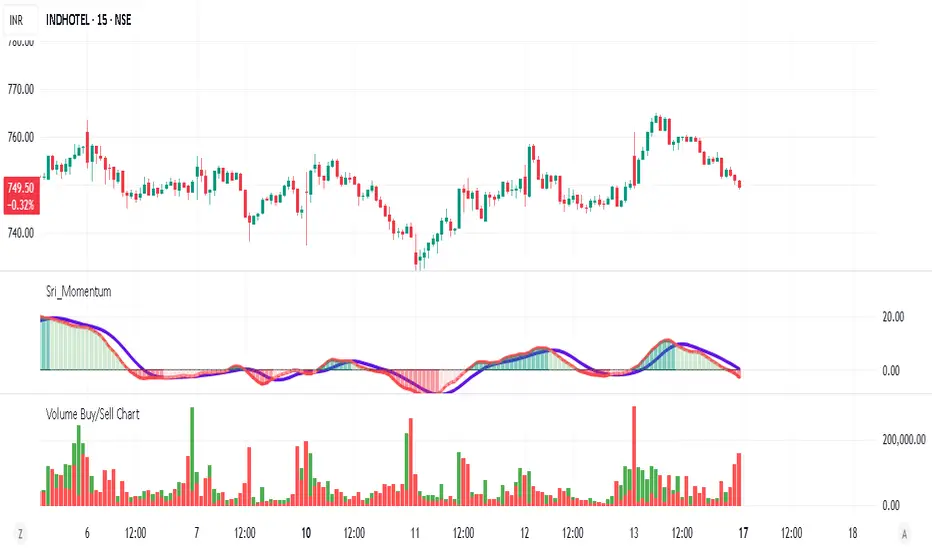
Volume Buy/Sell Chart
This script visualizes the distribution of buying and selling volume within each candlestick, helping traders identify dominant market pressure at a glance. It separates volume into Buy Volume (Green) and Sell Volume (Red) using a unique calculation based on price movement within a candle.
Features:
✅ Customizable Bar Display: Choose to display 5, 10, or 100 bars using a simple dropdown selection.
✅ Buy & Sell Volume Calculation: The script determines buying and selling volume dynamically based on price action within the candle.
✅ Custom Volume Threshold for Alerts: Set a percentage threshold (0–100) to trigger alerts when buy or sell volume exceeds a predefined level.
✅ Color-Coded Histogram:
Green Bars: Represent the estimated buy volume.
Red Bars: Represent the estimated sell volume.
✅ Alerts Integration: Automatically detect strong buy or sell signals when the respective volume percentage exceeds your set threshold.
How It Works:
The script calculates total price movement within a candle.
It then estimates buying and selling volume ratios based on whether the price closes higher or lower than it opened.
Finally, it normalizes the buy/sell volume against the total volume and plots it as a column chart.
Usage Guide:
Add the script to your chart.
Select how many bars to display (5, 10, or 100).
Adjust the Custom Volume Percentage Threshold (default: 75%).
Watch for significant buy/sell volume imbalances that might indicate market turning points!
This tool is great for traders looking to analyze volume flow and market sentiment with a simple yet effective visualization. 🚀
סקריפט קוד פתוח
ברוח האמיתית של TradingView, יוצר הסקריפט הזה הפך אותו לקוד פתוח, כך שסוחרים יוכלו לעיין בו ולאמת את פעולתו. כל הכבוד למחבר! אמנם ניתן להשתמש בו בחינם, אך זכור כי פרסום חוזר של הקוד כפוף ל־כללי הבית שלנו.
כתב ויתור
המידע והפרסומים אינם מיועדים להיות, ואינם מהווים, ייעוץ או המלצה פיננסית, השקעתית, מסחרית או מכל סוג אחר המסופקת או מאושרת על ידי TradingView. קרא עוד ב־תנאי השימוש.