OPEN-SOURCE SCRIPT
מעודכן Trendly

╭━━━━╮╱╱╱╱╱╱╱╱╭┳╮
┃╭╮╭╮┃╱╱╱╱╱╱╱╱┃┃┃
╰╯┃┃┣┻┳━━┳━╮╭━╯┃┃╭╮╱╭╮
╱╱┃┃┃╭┫┃━┫╭╮┫╭╮┃┃┃┃╱┃┃
╱╱┃┃┃┃┃┃━┫┃┃┃╰╯┃╰┫╰━╯┃
╱╱╰╯╰╯╰━━┻╯╰┻━━┻━┻━╮╭╯
╱╱╱╱╱╱╱╱╱╱╱╱╱╱╱╱╱╭━╯┃
╱╱╱╱╱╱╱╱╱╱╱╱╱╱╱╱╱╰━━╯
About the script:
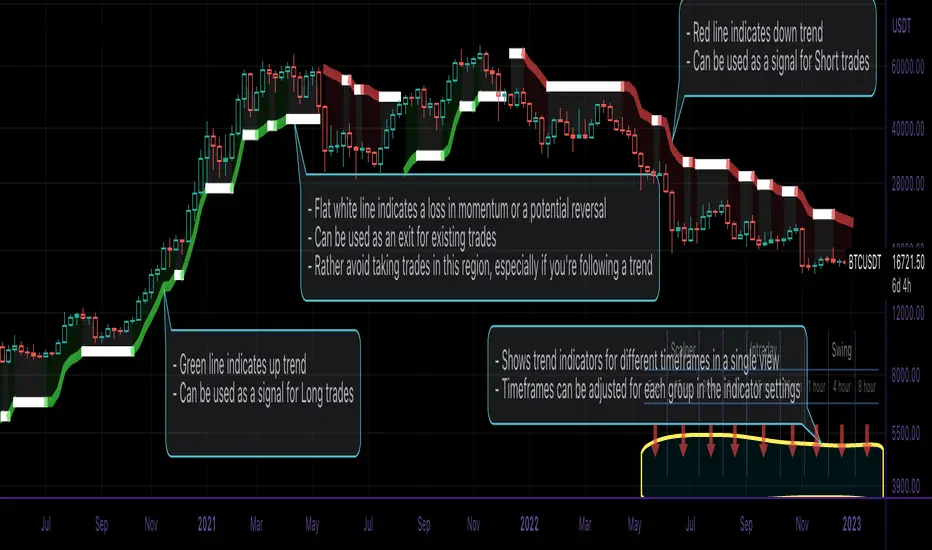
This script is an easy-to-use trend indicator, which is based on another popular indicator called "Supertrend". The basic idea is very simple, i.e. to compute Average True Range(ATR) and use that as the basis for trend detection. The key difference lies in a custom trend detection method, that computes trends across different timeframes and projects them in a table view. The script also tries to improve the behaviour of the existing indicator by highlighting flat regions on the chart, indicating sideways market or potential trend reversals.
How to use it:
You can use it just like any other indicator, add it to your chart and start analysing market trends. Results can be interpreted as follows.
Indicator output is currently made up of two main components:
>> Trend Table:
- Appears at the bottom right of your screen
- Contains trend indicator for 9 different timeframes
- Timeframes can be adjusted using indicator settings panel
- Green Up Arrow --> Up Trend
- Red Down Arrow --> Down Trend
>> Enhanced Supertrend:
- Shows up as a line plot on the chart
- Green line indicates up trend
- Red line indicates down trend
- White regions indicates slow moving markets or a potential trend reversal
- Indicator can be used on any timeframe, it provides a view of current and historical market trend
- Can be used as an indicator for entering/exiting trades
- Can be used to build custom trading strategies
הערות שחרור
Minor ReleaseSummary of the updates:
- Providing a new sensitivity controller that allows for a more granular control over the trend line
- Switched from snakeCasing to camel_casing
- Better formatting, minor adjustments to input texts, fixed some typos & a bit of code cleanup
הערות שחרור
# Minor releaseUpdates:
- Added option to select trend-table position
הערות שחרור
# Minor ReleaseUpdates:
- Added option to control trend-table text-size
סקריפט קוד פתוח
ברוח האמיתית של TradingView, יוצר הסקריפט הזה הפך אותו לקוד פתוח, כך שסוחרים יוכלו לעיין בו ולאמת את פעולתו. כל הכבוד למחבר! אמנם ניתן להשתמש בו בחינם, אך זכור כי פרסום חוזר של הקוד כפוף ל־כללי הבית שלנו.
כתב ויתור
המידע והפרסומים אינם מיועדים להיות, ואינם מהווים, ייעוץ או המלצה פיננסית, השקעתית, מסחרית או מכל סוג אחר המסופקת או מאושרת על ידי TradingView. קרא עוד ב־תנאי השימוש.