OPEN-SOURCE SCRIPT
Fences

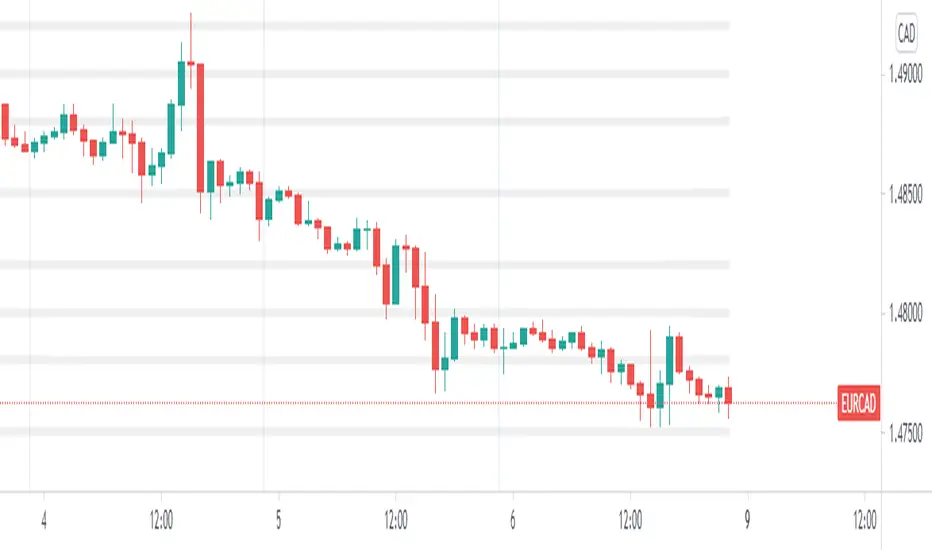
This is a simple script that plots horizontal grid on your chart using .x000 .x200 .x500 .x800 levels. Mike mentioned these levels in one of his videos.
Fences is only a semi-automatic indicator. You have to input the central point AND number of decimals yourself.
• Decimals are set to 3 but JPY pairs need it to be 1.
• Anchor point is the nearest level ending with three zeroes.
Fences is only a semi-automatic indicator. You have to input the central point AND number of decimals yourself.
• Decimals are set to 3 but JPY pairs need it to be 1.
• Anchor point is the nearest level ending with three zeroes.
הערות שחרור
A few visuals changed to look better on my charts.In addition, N1 N2 and N3 are now floats. So if you prefer 25 pip boxes as opposed to 200, 500, 800 levels, it is possible to set up now.
סקריפט קוד פתוח
ברוח האמיתית של TradingView, יוצר הסקריפט הזה הפך אותו לקוד פתוח, כך שסוחרים יוכלו לעיין בו ולאמת את פעולתו. כל הכבוד למחבר! אמנם ניתן להשתמש בו בחינם, אך זכור כי פרסום חוזר של הקוד כפוף ל־כללי הבית שלנו.
כתב ויתור
המידע והפרסומים אינם מיועדים להיות, ואינם מהווים, ייעוץ או המלצה פיננסית, השקעתית, מסחרית או מכל סוג אחר המסופקת או מאושרת על ידי TradingView. קרא עוד ב־תנאי השימוש.