OPEN-SOURCE SCRIPT
Relative Strength Index with Percentile

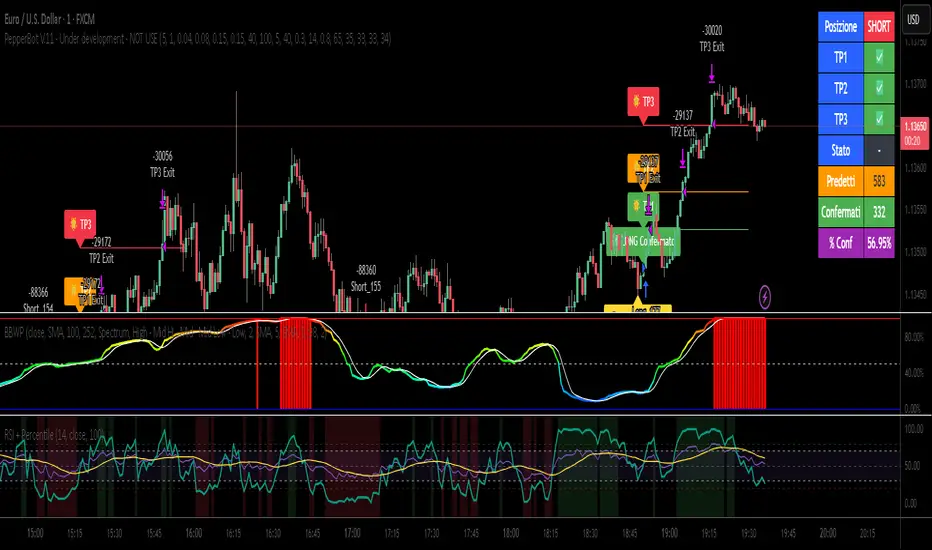
📈 Relative Strength Index with Percentile Rank (RSI + Percentile)
This advanced RSI indicator adds a powerful percentile ranking system to the classic Relative Strength Index, providing deeper insight into current RSI values relative to recent history.
🔍 Key Features:
Standard RSI Calculation: Identifies overbought/oversold levels using a customizable period.
RSI Percentile (0–100%): Calculates where the current RSI value stands within a user-defined lookback period.
Dynamic Background Coloring:
🟩 Green when RSI percentile is above 80% (strong relative strength)
🟥 Red when RSI percentile is below 20% (strong relative weakness)
Optional Divergence Detection: Spot classic bullish and bearish divergences between price and RSI.
Smoothing Options: Apply various moving averages (SMA, EMA, RMA, etc.) to the RSI, with optional Bollinger Bands.
Flexible Settings: Full control over lookback periods, smoothing type, and band sensitivity.
🧠 Why Use RSI Percentile?
Traditional RSI values can become less informative during trending markets. By ranking the RSI as a percentile, you gain contextual insight into whether the current strength is unusually high or low compared to recent history, rather than just a fixed 70/30 threshold.
סקריפט קוד פתוח
ברוח האמיתית של TradingView, יוצר הסקריפט הזה הפך אותו לקוד פתוח, כך שסוחרים יוכלו לעיין בו ולאמת את פעולתו. כל הכבוד למחבר! אמנם ניתן להשתמש בו בחינם, אך זכור כי פרסום חוזר של הקוד כפוף ל־כללי הבית שלנו.
כתב ויתור
המידע והפרסומים אינם מיועדים להיות, ואינם מהווים, ייעוץ או המלצה פיננסית, השקעתית, מסחרית או מכל סוג אחר המסופקת או מאושרת על ידי TradingView. קרא עוד ב־תנאי השימוש.