OPEN-SOURCE SCRIPT
Moving Fib Based on Donchain/Pivot/BB
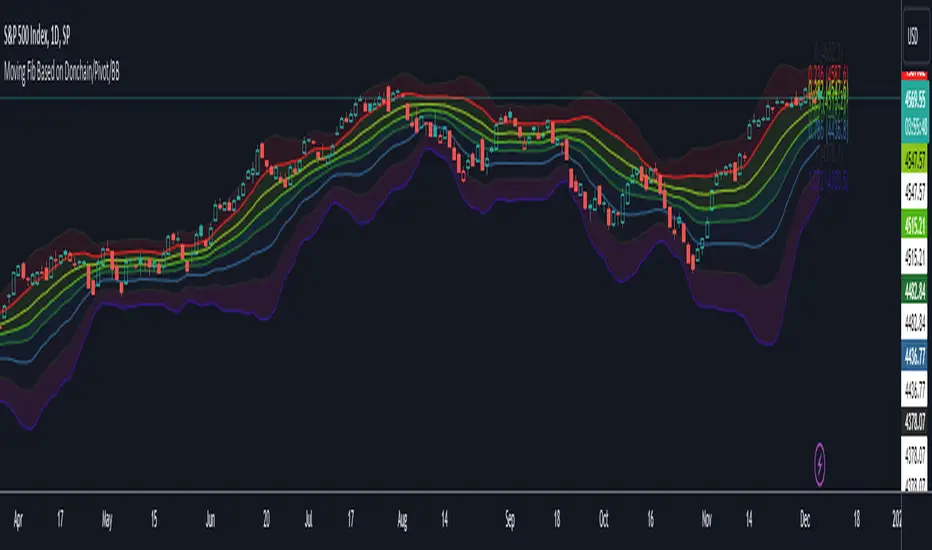
This script's purpose is to provide the user with an indicator that automatically plots Fibonacci levels. The user has three main options for determining the Fibonacci's high and low. This indicator offers an ample number of settings, making it a modular Fibonacci overlay.

The default setting is based on Donchian high and low.

Another option is to base the high and low on TradingView's Pivot indicator.

The last option is to determine Fibonacci levels based on Bollinger Bands.

Add up to 16 Fib levels with customizable settings, plot them on a log scale, and explore various other settings to personalize the Fib overlay.
This indicator can be utilized for trading momentum or mean reversion strategies
The default setting is based on Donchian high and low.
Another option is to base the high and low on TradingView's Pivot indicator.
The last option is to determine Fibonacci levels based on Bollinger Bands.
Add up to 16 Fib levels with customizable settings, plot them on a log scale, and explore various other settings to personalize the Fib overlay.
This indicator can be utilized for trading momentum or mean reversion strategies
סקריפט קוד פתוח
ברוח האמיתית של TradingView, יוצר הסקריפט הזה הפך אותו לקוד פתוח, כך שסוחרים יוכלו לעיין בו ולאמת את פעולתו. כל הכבוד למחבר! אמנם ניתן להשתמש בו בחינם, אך זכור כי פרסום חוזר של הקוד כפוף ל־כללי הבית שלנו.
כתב ויתור
המידע והפרסומים אינם מיועדים להיות, ואינם מהווים, ייעוץ או המלצה פיננסית, השקעתית, מסחרית או מכל סוג אחר המסופקת או מאושרת על ידי TradingView. קרא עוד ב־תנאי השימוש.