OPEN-SOURCE SCRIPT
מעודכן Previous Day High, Low + Today's Opening Price [DB]
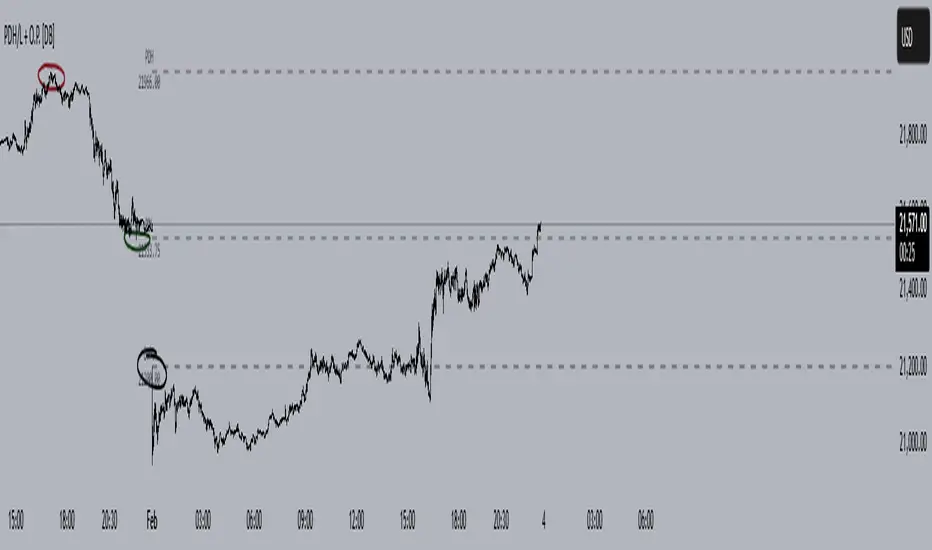
This indicator plots horizontal reference lines showing three price levels:
Settings & Customization
Labels:
The goal of this indicator is to simplify tracking potentionally important daily levels without manual drawing.
Works on all timeframes (from 1-minute to weekly charts). The levels auto-update daily at market open and they are non-repainting (historical levels stay fixed).
- Previous Day's High (PDH) – Dark red line by default
- Previous Day's Low (PDL) – Dark green line by default
- Today's Opening Price (O.P.) – Black line by default
Settings & Customization
- Adjust line colors, width (default: 2px), and transparency (30% by default).
- Choose line styles: Solid, Dashed, or Dotted.
Labels:
- Toggle labels (PDH/PDL/O.P.) on/off.
- Optional price values below labels.
The goal of this indicator is to simplify tracking potentionally important daily levels without manual drawing.
Works on all timeframes (from 1-minute to weekly charts). The levels auto-update daily at market open and they are non-repainting (historical levels stay fixed).
הערות שחרור
Fixed a bug where adding the indicator to the chart created a new price scale.סקריפט קוד פתוח
ברוח האמיתית של TradingView, יוצר הסקריפט הזה הפך אותו לקוד פתוח, כך שסוחרים יוכלו לעיין בו ולאמת את פעולתו. כל הכבוד למחבר! אמנם ניתן להשתמש בו בחינם, אך זכור כי פרסום חוזר של הקוד כפוף ל־כללי הבית שלנו.
כתב ויתור
המידע והפרסומים אינם מיועדים להיות, ואינם מהווים, ייעוץ או המלצה פיננסית, השקעתית, מסחרית או מכל סוג אחר המסופקת או מאושרת על ידי TradingView. קרא עוד ב־תנאי השימוש.
סקריפט קוד פתוח
ברוח האמיתית של TradingView, יוצר הסקריפט הזה הפך אותו לקוד פתוח, כך שסוחרים יוכלו לעיין בו ולאמת את פעולתו. כל הכבוד למחבר! אמנם ניתן להשתמש בו בחינם, אך זכור כי פרסום חוזר של הקוד כפוף ל־כללי הבית שלנו.
כתב ויתור
המידע והפרסומים אינם מיועדים להיות, ואינם מהווים, ייעוץ או המלצה פיננסית, השקעתית, מסחרית או מכל סוג אחר המסופקת או מאושרת על ידי TradingView. קרא עוד ב־תנאי השימוש.