INVITE-ONLY SCRIPT
High-Low- Signal (Expo)
מעודכן
High-Low-Signal (Expo)
DESCRIPTION
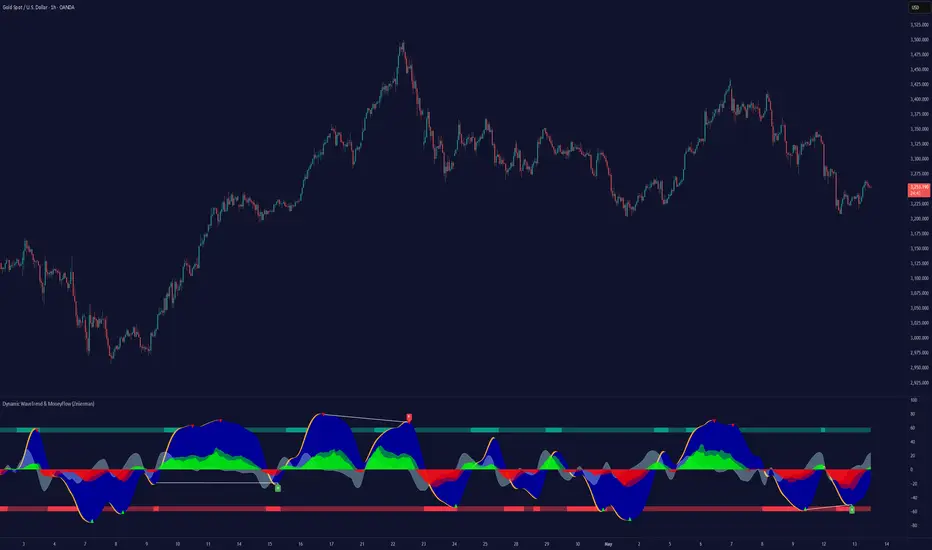
This simple but powerful High-Low indicator plots price extremes. Either it’s an exhausting sign or a continuation sign of the trend. The color of the cloud determines the trend, and the height of the peaks determines the strength in the price moves. You can easily compare current peaks with historical ones to understand the current dynamics and what might happen next.
This indicator is a must if you want to understand price dynamics in the market. The indicator is perfect to combine with other indicators to confirm the signal.
For example:
Combine it with trend lines/Channels/Bollinger Band, you name it! If the indicator peaks in conjunction with that the price reaches a trend line/Channels/Bollinger Band. It's a great sign!
HOW TO USE
1. Look for a signal
2. Identify the color and height of the peak. Compare it to historical ones to get an understanding of the current market dynamics.
3. Combine the indicator with e.g. trend lines/Channels/Bollinger Band
4. Consider Enter the market.
INDICATOR IN ACTION
BTCUSD

BTCUSD

BTCUSD

Wall Street

EURJPY

EURUSD

GOLD

I hope you find this indicator useful, and please comment or contact me if you like the script or have any questions/suggestions for future improvements. Thanks!
I will continue to work on this indicator, so please share your experience and feedback with me so that I can continuously improve it. Thanks to everyone that have contacted me regarding my scripts. Your feedback is valuable for future developments!
ACCESS THE INDICATOR
• Contact me on TradingView or use the links below
-----------------
Disclaimer
Copyright by Zeiierman.
The information contained in my scripts/indicators/ideas does not constitute financial advice or a solicitation to buy or sell any securities of any type. I will not accept liability for any loss or damage, including without limitation any loss of profit, which may arise directly or indirectly from use of or reliance on such information.
All investments involve risk, and the past performance of a security, industry, sector, market, financial product, trading strategy, or individual’s trading does not guarantee future results or returns. Investors are fully responsible for any investment decisions they make. Such decisions should be based solely on an evaluation of their financial circumstances, investment objectives, risk tolerance, and liquidity needs.
My scripts/indicators/ideas are only for educational purposes!
DESCRIPTION
This simple but powerful High-Low indicator plots price extremes. Either it’s an exhausting sign or a continuation sign of the trend. The color of the cloud determines the trend, and the height of the peaks determines the strength in the price moves. You can easily compare current peaks with historical ones to understand the current dynamics and what might happen next.
This indicator is a must if you want to understand price dynamics in the market. The indicator is perfect to combine with other indicators to confirm the signal.
For example:
Combine it with trend lines/Channels/Bollinger Band, you name it! If the indicator peaks in conjunction with that the price reaches a trend line/Channels/Bollinger Band. It's a great sign!
HOW TO USE
1. Look for a signal
2. Identify the color and height of the peak. Compare it to historical ones to get an understanding of the current market dynamics.
3. Combine the indicator with e.g. trend lines/Channels/Bollinger Band
4. Consider Enter the market.
INDICATOR IN ACTION
BTCUSD
BTCUSD
BTCUSD
Wall Street
EURJPY
EURUSD
GOLD
I hope you find this indicator useful, and please comment or contact me if you like the script or have any questions/suggestions for future improvements. Thanks!
I will continue to work on this indicator, so please share your experience and feedback with me so that I can continuously improve it. Thanks to everyone that have contacted me regarding my scripts. Your feedback is valuable for future developments!
ACCESS THE INDICATOR
• Contact me on TradingView or use the links below
-----------------
Disclaimer
Copyright by Zeiierman.
The information contained in my scripts/indicators/ideas does not constitute financial advice or a solicitation to buy or sell any securities of any type. I will not accept liability for any loss or damage, including without limitation any loss of profit, which may arise directly or indirectly from use of or reliance on such information.
All investments involve risk, and the past performance of a security, industry, sector, market, financial product, trading strategy, or individual’s trading does not guarantee future results or returns. Investors are fully responsible for any investment decisions they make. Such decisions should be based solely on an evaluation of their financial circumstances, investment objectives, risk tolerance, and liquidity needs.
My scripts/indicators/ideas are only for educational purposes!
הערות שחרור
Improvements! - Volatility filter added!
הערות שחרור
Improvements! - Alerts Added
הערות שחרור
Improvements!סקריפט להזמנה בלבד
הגישה לסקריפט זה מוגבלת למשתמשים שהוסמכו על ידי הכותב ובדרך כלל דורשת תשלום. אתה יכול להוסיף אותו למועדפים שלך, אך תוכל להשתמש בו רק לאחר שתבקש אישור ותקבל אותו מהמחבר שלו. למידע נוסף, צור קשר עם Zeiierman, או עקוב אחר הוראות המחבר למטה.
TradingView לא מציעה לשלם עבור סקריפט ולהשתמש בו אלא אם כן אתה סומך ב-100% על המחבר שלו ומבין כיצד הסקריפט עובד. במקרים רבים, אתה יכול למצוא אלטרנטיבה טובה לקוד פתוח בחינם בבסקריפטים הקהילתיים שלנו.
הוראות המחבר
″Get instant access here: https://zeiiermantrading.com
רוצה להשתמש בסקריפ זה בגרף?
אזהרה: נא לקרוא לפני בקשת גישה.
Join Our Free Discord: discord.gg/zeiiermantrading
Access my indicators at: linktr.ee/zeiierman_trading
Earn $15
tradingview.com/gopro/?share_your_love=Zeiierman
SMC Trading
linktr.ee/zeiierman_trading
Access my indicators at: linktr.ee/zeiierman_trading
Earn $15
tradingview.com/gopro/?share_your_love=Zeiierman
SMC Trading
linktr.ee/zeiierman_trading
כתב ויתור
המידע והפרסומים אינם אמורים להיות, ואינם מהווים, עצות פיננסיות, השקעות, מסחר או סוגים אחרים של עצות או המלצות שסופקו או מאושרים על ידי TradingView. קרא עוד בתנאים וההגבלות.