OPEN-SOURCE SCRIPT
ETH vs BTC 200W SMA Overextension
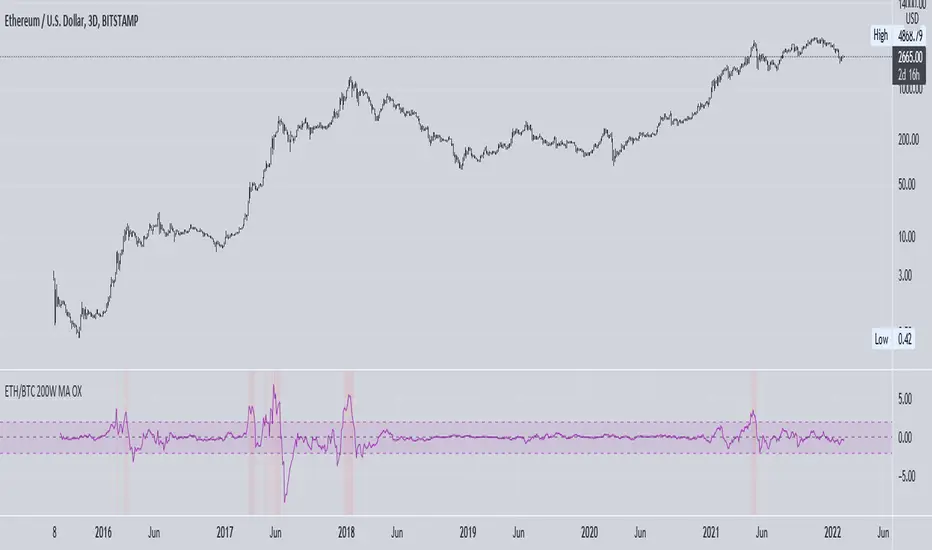
Historically, when BTC suffers a correction and ETH continues to rally, this hints at an impending market-wide correction. In Jan 2018, ETH rallies while BTC corrects, signalling the end of the bull cycle. In May 2021, ETH rallies while BTC ranges between $50-$60k, then a major correction occurs. This indicator attempts to monitor this phenomenon in order to help spot potential macro tops in the cryptocurrency market.
The indicator takes the price of the asset and divides it by the 200 week SMA value. This gives an over/undervaluation in percentage terms. When ETH becomes significantly more overvalued relative to BTC, the indicator will warn of a potential top forming (see red shaded areas).
This is for edutainment purposes only. Don't make financial decisions based on this indicator.
סקריפט קוד פתוח
ברוח האמיתית של TradingView, יוצר הסקריפט הזה הפך אותו לקוד פתוח, כך שסוחרים יוכלו לעיין בו ולאמת את פעולתו. כל הכבוד למחבר! אמנם ניתן להשתמש בו בחינם, אך זכור כי פרסום חוזר של הקוד כפוף ל־כללי הבית שלנו.
כתב ויתור
המידע והפרסומים אינם מיועדים להיות, ואינם מהווים, ייעוץ או המלצה פיננסית, השקעתית, מסחרית או מכל סוג אחר המסופקת או מאושרת על ידי TradingView. קרא עוד ב־תנאי השימוש.