PROTECTED SOURCE SCRIPT
Phase Accumulate/Manipulate/Distribute - NY [nainoa_invest]
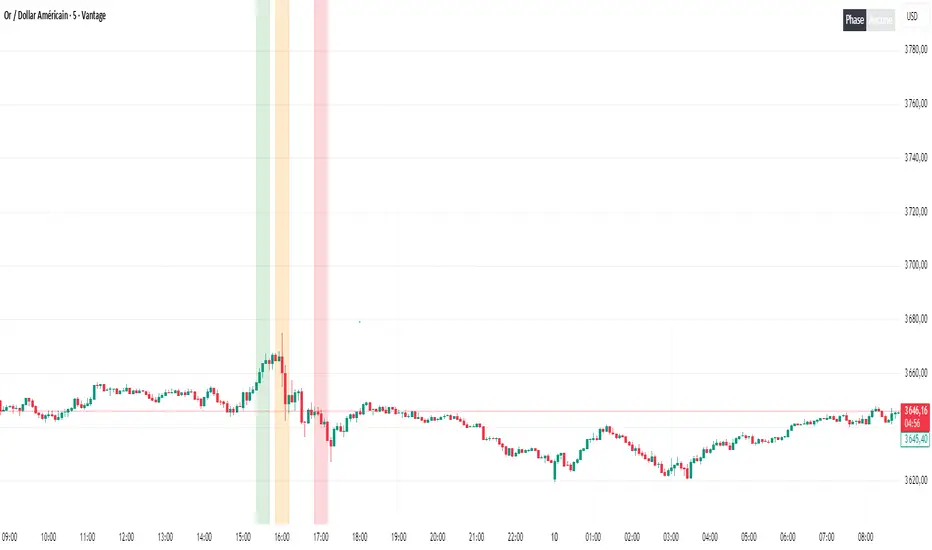
This TradingView script allows you to identify and visualize the different phases of an asset in the New York market (EST/GMT-4): Accumulation, Manipulation, and Distribution.
Key Features:
Phase Visualization on Chart: Each phase is displayed as a colored rectangle (green for accumulation, orange for manipulation, red for distribution) to easily track market movements.
Dynamic Dashboard: A table shows the current phase in real-time directly on the chart, with customizable colors.
Customizable Settings: You can adjust phase colors, dashboard position and size, and border style.
Precise Time Windows: Phases are automatically calculated based on specific NY session hours for better market behavior tracking.
This script is ideal for traders who want to quickly identify key market phases and make more informed trading decisions.
If you want to use this script, you can contact me directly.
סקריפט מוגן
סקריפט זה פורסם כמקור סגור. עם זאת, אתה יכול להשתמש בו באופן חופשי וללא כל הגבלה - למד עוד כאן.
כתב ויתור
המידע והפרסומים אינם אמורים להיות, ואינם מהווים, עצות פיננסיות, השקעות, מסחר או סוגים אחרים של עצות או המלצות שסופקו או מאושרים על ידי TradingView. קרא עוד בתנאים וההגבלות.
סקריפט מוגן
סקריפט זה פורסם כמקור סגור. עם זאת, אתה יכול להשתמש בו באופן חופשי וללא כל הגבלה - למד עוד כאן.
כתב ויתור
המידע והפרסומים אינם אמורים להיות, ואינם מהווים, עצות פיננסיות, השקעות, מסחר או סוגים אחרים של עצות או המלצות שסופקו או מאושרים על ידי TradingView. קרא עוד בתנאים וההגבלות.