PROTECTED SOURCE SCRIPT
Relative Volatility Oscillator
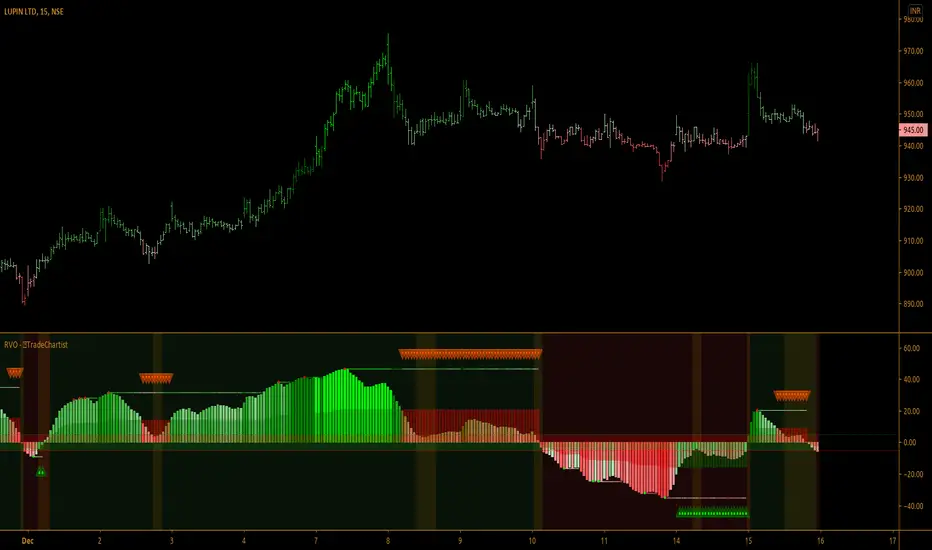
Relative Volatility Oscillator is a volatility based oscillator and works very well on Lower Time Frames on volatile assets. It uses one of five periods (34,55,89,144,233) to calculate relative volatility of the current bar with the volatility trend of one of the 5 periods from the settings, using percentile rank.
Features of Relative Volatility Oscillator
Features of Relative Volatility Oscillator
- Choice of one of five periods for the Relative Volatility Oscillator plot.
- SOS Triangles to indicate Bull/Bear Exhaustion.
- Option to plot Volatility Zones. Oscillator Values between -5 and 5 will be plotted using exhaustion colours and can be used to monitor trades closely for trend reversals.
- Choice of 3 colour themes including option to plot trend based coloured price bars.
סקריפט מוגן
סקריפט זה פורסם כמקור סגור. עם זאת, תוכל להשתמש בו בחופשיות וללא כל מגבלות – למד עוד כאן
Get in touch with me if you would like access to my Premium scripts for a trial before deciding on lifetime access.
Telegram - @Trade_Chartist
Free Scripts - bit.ly/Free-Scripts
Telegram - @Trade_Chartist
Free Scripts - bit.ly/Free-Scripts
כתב ויתור
המידע והפרסומים אינם מיועדים להיות, ואינם מהווים, ייעוץ או המלצה פיננסית, השקעתית, מסחרית או מכל סוג אחר המסופקת או מאושרת על ידי TradingView. קרא עוד ב־תנאי השימוש.