PROTECTED SOURCE SCRIPT
מעודכן Medium-Term Valuation | MiesOnCharts
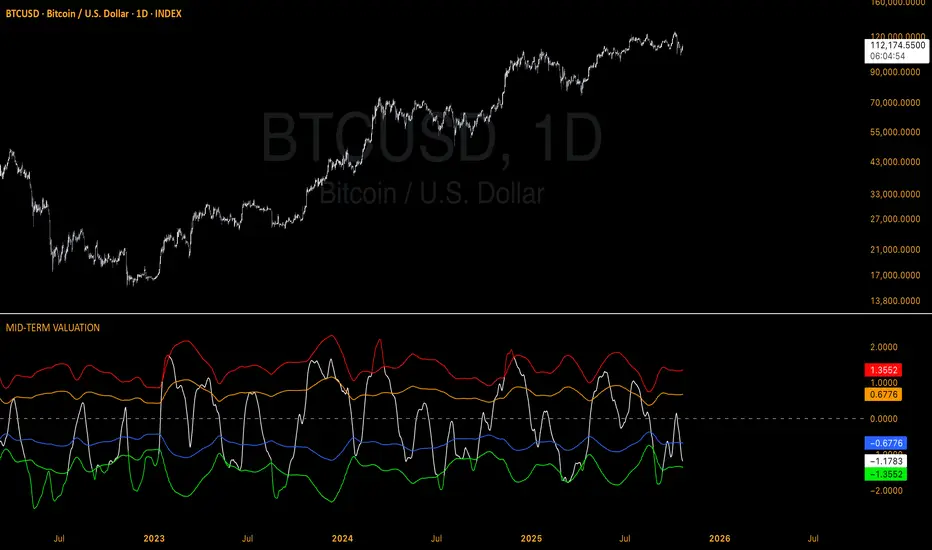
This medium-term valuation indicator integrates multiple valuation metrics to assist investors in identifying oversold and overbought market conditions with greater precision.
How to Interpret:
The indicator employs adaptive standard deviation bands to define extreme market zones. The red band signals a strongly overbought condition, while the green band indicates a significantly oversold condition.
How to Apply:
Investors can leverage these extreme levels as strategic points for taking profits or implementing dollar-cost averaging (DCA) strategies, optimizing entry and exit decisions in the market.
Disclaimer: NOT Financial advice. Past performance is not indicative of future results. No trading strategy can guarantee success in financial markets.
הערות שחרור
/סקריפט מוגן
סקריפט זה פורסם כמקור סגור. עם זאת, אתה יכול להשתמש בו באופן חופשי וללא כל הגבלה - למד עוד כאן.
כתב ויתור
המידע והפרסומים אינם אמורים להיות, ואינם מהווים, עצות פיננסיות, השקעות, מסחר או סוגים אחרים של עצות או המלצות שסופקו או מאושרים על ידי TradingView. קרא עוד בתנאים וההגבלות.
סקריפט מוגן
סקריפט זה פורסם כמקור סגור. עם זאת, אתה יכול להשתמש בו באופן חופשי וללא כל הגבלה - למד עוד כאן.
כתב ויתור
המידע והפרסומים אינם אמורים להיות, ואינם מהווים, עצות פיננסיות, השקעות, מסחר או סוגים אחרים של עצות או המלצות שסופקו או מאושרים על ידי TradingView. קרא עוד בתנאים וההגבלות.