OPEN-SOURCE SCRIPT
Earnings Surprise Indicator (Post-Earnings Announcement Drift)
What It Does:
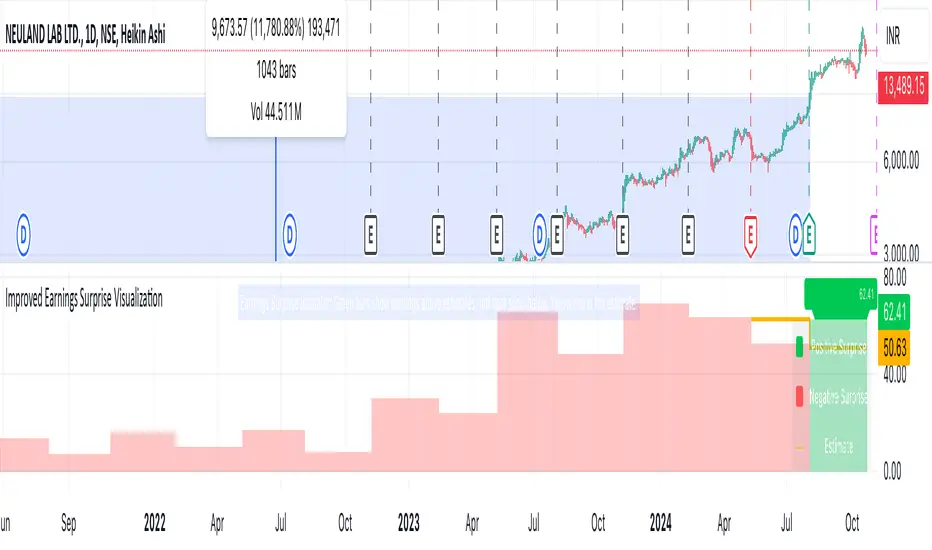
- Displays a company's actual earnings vs. analysts' estimates over time
- Shows "earnings surprises" - when actual results beat or miss expectations
- Helps identify trends in a company's financial performance
How It Works:
- Green bars: Positive surprise (earnings beat estimates)
- Red bars: Negative surprise (earnings missed estimates)
- Yellow line: Analysts' earnings estimates
Correlation with Post Earnings Announcement Drift (PEAD): PEAD is the tendency for a stock's price to drift in the direction of an earnings surprise for several weeks or months after the announcement.
Why It Matters:
- Positive surprises often lead to upward price drift
- Negative surprises often lead to downward price drift
- This drift can create trading opportunities
How to Use It:
1. Spot Trends:
- Consistent beats may indicate strong company performance
- Consistent misses may signal underlying issues
2. Gauge Market Expectations:
- Large surprises may lead to significant price movements
3. Timing Decisions:
- Consider long positions after positive surprises
- Consider short positions or exits after negative surprises
4. Risk Management:
- Be cautious of reversal if the drift seems excessive
- Use in conjunction with other technical and fundamental analysis
Key Takeaways:
- Earnings surprises can be fundamental-leading indicators of future stock performance, especially when correlated with analyst projections
- PEAD suggests that markets often underreact to earnings news initially
- This indicator helps visualize the magnitude and direction of surprises
- It can be a valuable tool for timing entry and exit points in trades
סקריפט קוד פתוח
ברוח האמיתית של TradingView, יוצר הסקריפט הזה הפך אותו לקוד פתוח, כך שסוחרים יוכלו לעיין בו ולאמת את פעולתו. כל הכבוד למחבר! אמנם ניתן להשתמש בו בחינם, אך זכור כי פרסום חוזר של הקוד כפוף ל־כללי הבית שלנו.
כתב ויתור
המידע והפרסומים אינם מיועדים להיות, ואינם מהווים, ייעוץ או המלצה פיננסית, השקעתית, מסחרית או מכל סוג אחר המסופקת או מאושרת על ידי TradingView. קרא עוד ב־תנאי השימוש.