OPEN-SOURCE SCRIPT
TOTAL:(RSI+TSI)
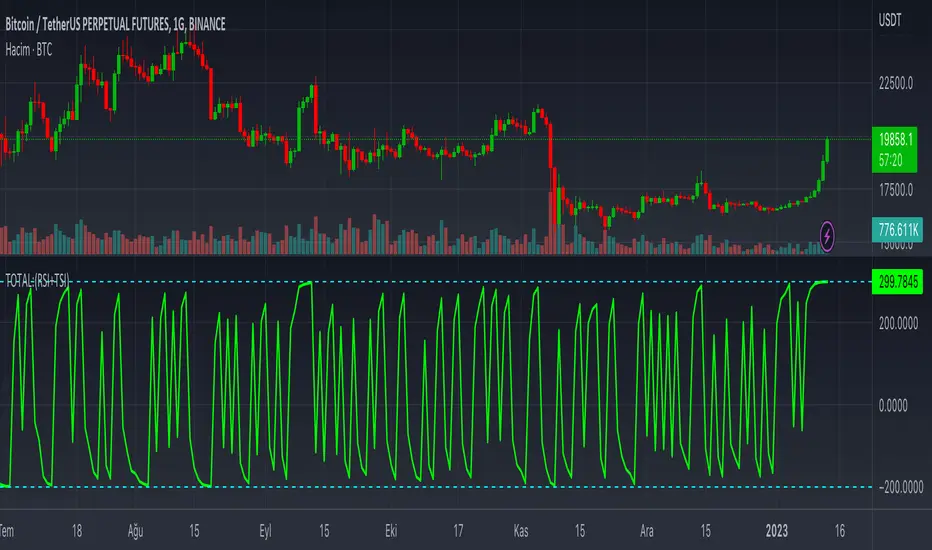
TOTAL:(RSI+TSI)
This indicator collects instant data of RSI and TSI oscillators. RSI moves between (0) and (100) values as a moving line, while TSI moves between (-100) and (+100) values as two moving lines.
The top value of the sum of these values is graphically;
It takes the total value (+300) from RSI (+100), TSI (+100) and (+100).
The lowest value of the sum of these values is graphically;
It takes the value (-200) from the RSI (0), (-100) and (-100) from the TSI.
In case this indicator approaches (+300) graphically; It can be seen that price candlesticks mostly move upwards. This may not always give accurate results. Past incompatibilities can affect this situation.
In case this indicator approaches (-200) graphically; It can be seen that price candlesticks mostly move downwards. This may not always give accurate results. Past incompatibilities can affect this situation.
The graphical movements and numerical values created by this indicator do not give precise results for price candles.
סקריפט קוד פתוח
ברוח האמיתית של TradingView, יוצר הסקריפט הזה הפך אותו לקוד פתוח, כך שסוחרים יוכלו לעיין בו ולאמת את פעולתו. כל הכבוד למחבר! אמנם ניתן להשתמש בו בחינם, אך זכור כי פרסום חוזר של הקוד כפוף ל־כללי הבית שלנו.
כתב ויתור
המידע והפרסומים אינם מיועדים להיות, ואינם מהווים, ייעוץ או המלצה פיננסית, השקעתית, מסחרית או מכל סוג אחר המסופקת או מאושרת על ידי TradingView. קרא עוד ב־תנאי השימוש.