OPEN-SOURCE SCRIPT
מעודכן Auto AB=CD 1 to 1 Ratio Experimental

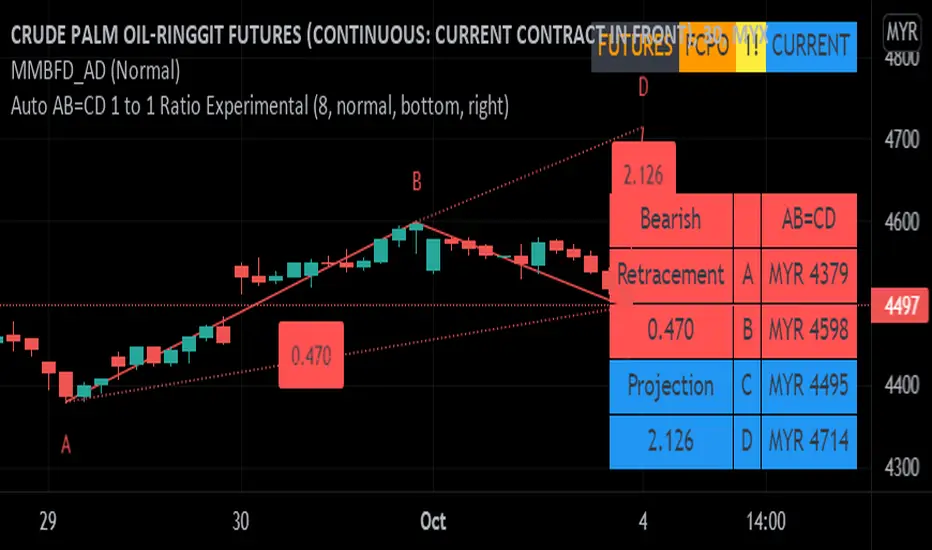
This indicator was experimental based AB=CD, shows last AB=CD either Standard AB=CD or Reciprocal AB=CD which uses time instead of bar_index.
This build is based upon educational materials (refer below resources).
ABCD are based on 1 to 1 Ratio for price and time.
Features / Pros:
1. Show last AB=CD points and lines including table value.
2. Customize table position and size.
3. For desktop display only, not for mobile.
Cons:
1. Time for point D less accurate for intraday timeframe (minute, hour, etc) which may including holidays and depends on price volatility.
2. Label ratio not shown properly depends on timeframe especially for intraday timeframe and maybe for Daily and Weekly timeframe.
3. Experimental code, use at your own risk.
FAQ
1. Credits
Scott M Carney, Harmonic Trading: Volume One and Two.
LonesomeTheBlue for zigzag array source code.
HeWhoMustNotBeNamed for some guidance and advice.
2. Previous Build / Resources
Link 1
Link 2
Link 3
Link 4
3. Code Usage
Free to use for personal usage.
Left : Bullish AB=CD, Right : Bullish Reciprocal AB=CD

Left : Bearish AB=CD, Right : Bearish Reciprocal AB=CD

This build is based upon educational materials (refer below resources).
ABCD are based on 1 to 1 Ratio for price and time.
Features / Pros:
1. Show last AB=CD points and lines including table value.
2. Customize table position and size.
3. For desktop display only, not for mobile.
Cons:
1. Time for point D less accurate for intraday timeframe (minute, hour, etc) which may including holidays and depends on price volatility.
2. Label ratio not shown properly depends on timeframe especially for intraday timeframe and maybe for Daily and Weekly timeframe.
3. Experimental code, use at your own risk.
FAQ
1. Credits
Scott M Carney, Harmonic Trading: Volume One and Two.
LonesomeTheBlue for zigzag array source code.
HeWhoMustNotBeNamed for some guidance and advice.
2. Previous Build / Resources
Link 1
Link 2
Link 3
Link 4
3. Code Usage
Free to use for personal usage.
Left : Bullish AB=CD, Right : Bullish Reciprocal AB=CD
Left : Bearish AB=CD, Right : Bearish Reciprocal AB=CD
הערות שחרור
Code clean up.1. Follow Pine Script Coding Conventions
2. Add dependencies comment
3. Remove fun_avg()
4. Add abs() to ratio_CD
הערות שחרור
Convert to Pine Script v5הערות שחרור
Change Ternary function to switchהערות שחרור
Code clean upסקריפט קוד פתוח
ברוח האמיתית של TradingView, יוצר הסקריפט הזה הפך אותו לקוד פתוח, כך שסוחרים יוכלו לעיין בו ולאמת את פעולתו. כל הכבוד למחבר! אמנם ניתן להשתמש בו בחינם, אך זכור כי פרסום חוזר של הקוד כפוף ל־כללי הבית שלנו.
כתב ויתור
המידע והפרסומים אינם מיועדים להיות, ואינם מהווים, ייעוץ או המלצה פיננסית, השקעתית, מסחרית או מכל סוג אחר המסופקת או מאושרת על ידי TradingView. קרא עוד ב־תנאי השימוש.
סקריפט קוד פתוח
ברוח האמיתית של TradingView, יוצר הסקריפט הזה הפך אותו לקוד פתוח, כך שסוחרים יוכלו לעיין בו ולאמת את פעולתו. כל הכבוד למחבר! אמנם ניתן להשתמש בו בחינם, אך זכור כי פרסום חוזר של הקוד כפוף ל־כללי הבית שלנו.
כתב ויתור
המידע והפרסומים אינם מיועדים להיות, ואינם מהווים, ייעוץ או המלצה פיננסית, השקעתית, מסחרית או מכל סוג אחר המסופקת או מאושרת על ידי TradingView. קרא עוד ב־תנאי השימוש.