OPEN-SOURCE SCRIPT
Duong_Sideway Zone

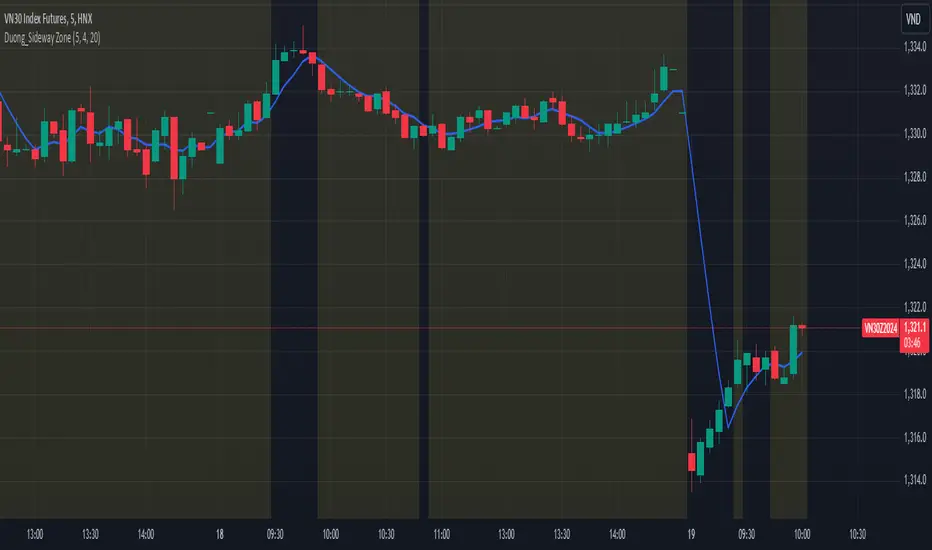
This indicator is designed to identify sideway (ranging) zones on the price chart. It uses a Moving Average (MA) and criteria such as the number of price crosses over the MA, as well as breakout checks, to determine whether the market is in a sideway state. When a sideway zone is detected, it is highlighted with a yellow background on the chart.
Key Features:
MA Line: Uses a Moving Average (MA) as the basis for trend identification.
Sideway Threshold: Based on the number of price crosses over the MA within a specific period.
Breakout Check: Excludes zones from being considered sideway if a breakout occurs beyond the ATR threshold.
Visual Highlighting: Highlights sideway zones with a yellow background for easy identification.
This indicator is ideal for traders looking to identify ranging market phases to adjust their trading strategies accordingly.
For example, if within the last 20 candles, the number of times the closing price crosses the MA5 is greater than 4, it is considered a sideway zone, except in cases where the closing price of a recent candle has broken out of the highest/ lowest price of the previous 20 candles.
סקריפט קוד פתוח
ברוח האמיתית של TradingView, יוצר הסקריפט הזה הפך אותו לקוד פתוח, כך שסוחרים יוכלו לעיין בו ולאמת את פעולתו. כל הכבוד למחבר! אמנם ניתן להשתמש בו בחינם, אך זכור כי פרסום חוזר של הקוד כפוף ל־כללי הבית שלנו.
כתב ויתור
המידע והפרסומים אינם מיועדים להיות, ואינם מהווים, ייעוץ או המלצה פיננסית, השקעתית, מסחרית או מכל סוג אחר המסופקת או מאושרת על ידי TradingView. קרא עוד ב־תנאי השימוש.