OPEN-SOURCE SCRIPT
BOS/CHOCH Demand & Supply
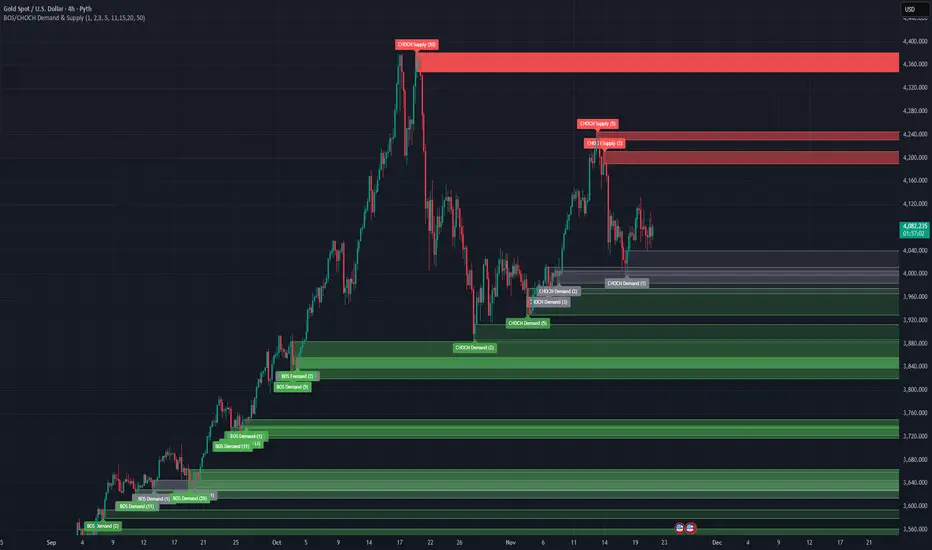
This indicator automatically identifies and plots Supply and Demand zones based on Smart Money Concepts (SMC) methodology. It detects structural breaks in price action and marks the origin zones that initiated these moves.
How It Works (Technical Methodology)
1. Swing Point Detection
The indicator uses Pine Script's ta.pivothigh() and ta.pivotlow() functions to identify swing highs and lows. Users can input multiple lookback periods (e.g., 1, 2, 3, 5, 11, 15, 20) to detect structure across different timeframe perspectives simultaneously.
2. Break of Structure (BOS) Detection
A Bullish BOS is confirmed when:
Current candle closes above the last swing high
Previous candle's high was still below that swing high
The current swing high is higher than the previous swing high (trend continuation)
A Bearish BOS is confirmed when:
Current candle closes below the last swing low
Previous candle's low was still above that swing low
The current swing low is lower than the previous swing low (trend continuation)
3. Change of Character (CHOCH) Detection
A Bullish CHOCH is confirmed when:
Price breaks above the last swing high
But that swing high was lower than the previous swing high (potential reversal signal)
A Bearish CHOCH is confirmed when:
Price breaks below the last swing low
But that swing low was higher than the previous swing low (potential reversal signal)
4. Inducement / Liquidity Grab Filter (Optional)
When enabled, zones are only drawn if the swing point that created them first grabbed liquidity from the previous swing:
For Demand zones: The swing low must have traded below the previous swing low before the bullish break
For Supply zones: The swing high must have traded above the previous swing high before the bearish break
This filter helps identify higher-probability zones where stop-losses were likely triggered before the move.
5. Zone Construction
Demand Zone (Bullish):
Top boundary: max(open, close) of the swing low candle
Bottom boundary: low of the swing low candle
Supply Zone (Bearish):
Top boundary: high of the swing high candle
Bottom boundary: min(open, close) of the swing high candle
This captures the candle body-to-wick range where institutional orders likely reside.
6. Zone Lifecycle Management
Active Zone: Displayed in green (demand) or red (supply)
Mitigated Zone: When price touches the zone but doesn't break it, the zone turns gray (indicating partial fill)
Broken Zone: When price fully breaks through the zone, it is automatically deleted from the chart
How to Use
Demand Zones (Green): Look for long entries when price returns to these zones. The zone represents where buying pressure previously overcame selling.
Supply Zones (Red): Look for short entries when price returns to these zones. The zone represents where selling pressure previously overcame buying.
BOS Zones: Indicate trend continuation - trade in the direction of the break.
CHOCH Zones: Indicate potential reversal - these are early warning signals of trend change.
Enable "Require Inducement" for higher-quality setups where liquidity was grabbed before the structural break.
Multi-Lookback Periods: Using multiple values helps identify zones across different structural levels. Smaller values catch minor structure; larger values catch major structure.
Disclaimer
This indicator is a technical analysis tool and should be used in conjunction with other forms of analysis. Past performance does not guarantee future results. Always use proper risk management.
סקריפט קוד פתוח
ברוח האמיתית של TradingView, יוצר הסקריפט הזה הפך אותו לקוד פתוח, כך שסוחרים יוכלו לעיין בו ולאמת את פעולתו. כל הכבוד למחבר! אמנם ניתן להשתמש בו בחינם, אך זכור כי פרסום חוזר של הקוד כפוף ל־כללי הבית שלנו.
כתב ויתור
המידע והפרסומים אינם מיועדים להיות, ואינם מהווים, ייעוץ או המלצה פיננסית, השקעתית, מסחרית או מכל סוג אחר המסופקת או מאושרת על ידי TradingView. קרא עוד ב־תנאי השימוש.